| Red | Green | Blue | |
| z | 17.64 | ||
| znorm | Inf | ||
| sky | -Inf | -Inf | -Inf |
| S/N | 33.0 | 60.2 | 66.5 |
| S/N(c) | 0.0 | 0.0 | 0.0 |
| SN(E/C) |

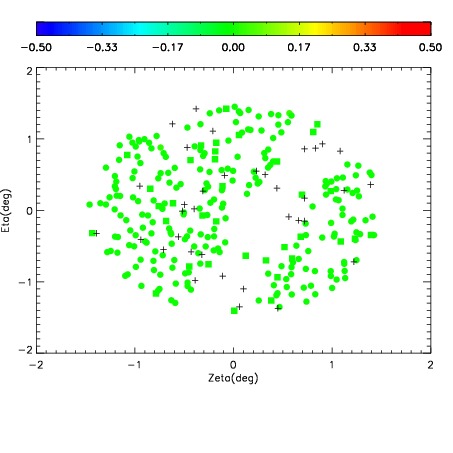
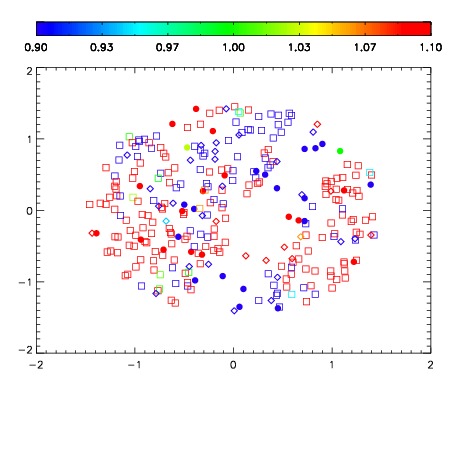
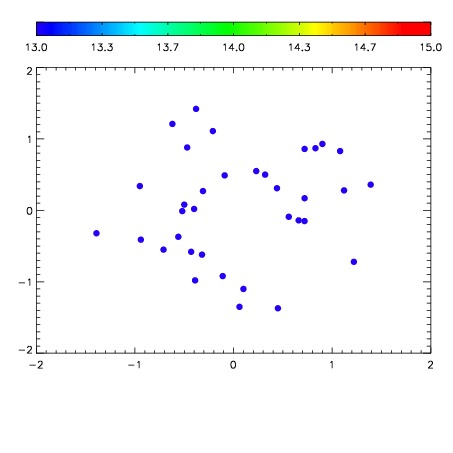

| Frame | Nreads | Zeropoints | Mag plots | Spatial mag deviation | Spatial sky 16325A emission deviations (filled: sky, open: star) | Spatial sky continuum emission | Spatial sky telluric CO2 absorption deviations (filled: H < 10) | |||||||||||||||||||||||
| 0 | 0 |
|
|
|
|
|
|
| IPAIR | NAME | SHIFT | NEWSHIFT | S/N | NAME | SHIFT | NEWSHIFT | S/N |
| 0 | 10920079 | 0.510800 | 0.00000 | 156.206 | 10920074 | -0.00244407 | 0.513244 | 158.262 |
| 1 | 10920071 | 0.510664 | 0.000136018 | 157.998 | 10920073 | -0.00219159 | 0.512992 | 163.347 |
| 2 | 10920075 | 0.509771 | 0.00102901 | 157.919 | 10920081 | -0.00223836 | 0.513038 | 160.049 |
| 3 | 10920080 | 0.510697 | 0.000102997 | 156.840 | 10920085 | -0.00382212 | 0.514622 | 159.301 |
| 4 | 10920072 | 0.510293 | 0.000506997 | 155.975 | 10920082 | -0.00258153 | 0.513382 | 157.147 |
| 5 | 10920084 | 0.507651 | 0.00314903 | 155.891 | 10920070 | 0.00000 | 0.510800 | 153.610 |
| 6 | 10920083 | 0.507923 | 0.00287700 | 153.422 | 10920077 | -0.00267352 | 0.513474 | 153.021 |
| 7 | 10920076 | 0.510149 | 0.000651002 | 153.020 | 10920078 | -0.00236119 | 0.513161 | 152.242 |