| Red | Green | Blue | |
| z | 17.64 | ||
| znorm | Inf | ||
| sky | -Inf | -Inf | -Inf |
| S/N | 21.7 | 39.9 | 43.9 |
| S/N(c) | 0.0 | 0.0 | 0.0 |
| SN(E/C) |
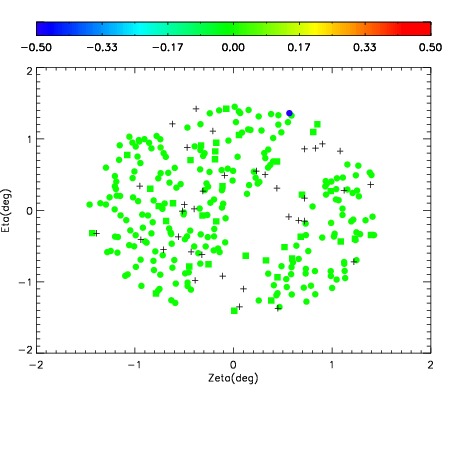
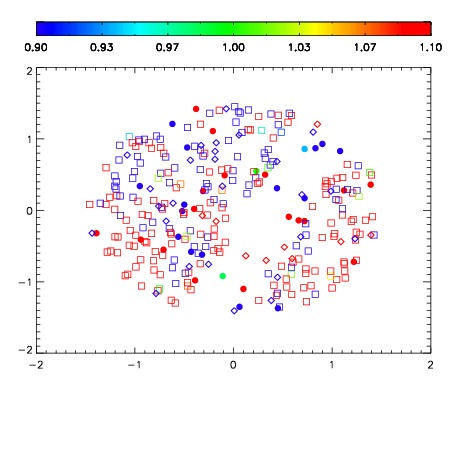
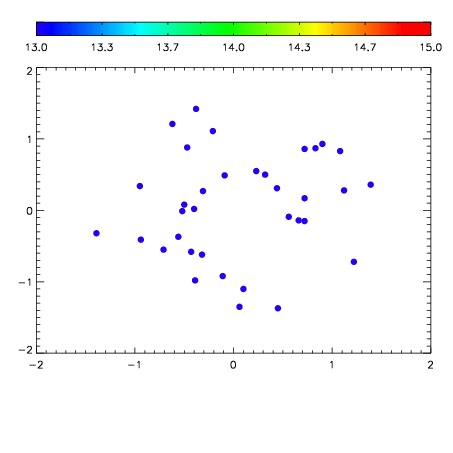

| Frame | Nreads | Zeropoints | Mag plots | Spatial mag deviation | Spatial sky 16325A emission deviations (filled: sky, open: star) | Spatial sky continuum emission | Spatial sky telluric CO2 absorption deviations (filled: H < 10) | |||||||||||||||||||||||
| 0 | 0 |
|
|
|
|
|
|
| IPAIR | NAME | SHIFT | NEWSHIFT | S/N | NAME | SHIFT | NEWSHIFT | S/N |
| 0 | 11100083 | 0.479615 | 0.00000 | 195.834 | 11100085 | 0.000739894 | 0.478875 | 183.279 |
| 1 | 11100087 | 0.479590 | 2.50041e-05 | 202.771 | 11100088 | -0.000419048 | 0.480034 | 206.311 |
| 2 | 11100086 | 0.479152 | 0.000463009 | 194.766 | 11100081 | 0.00000 | 0.479615 | 173.894 |
| 3 | 11100082 | 0.478814 | 0.000800997 | 189.472 | 11100084 | 0.00108042 | 0.478535 | 147.239 |