| Red | Green | Blue | |
| z | 17.64 | ||
| znorm | Inf | ||
| sky | -Inf | -Inf | -Inf |
| S/N | 21.9 | 38.3 | 43.3 |
| S/N(c) | 0.0 | 0.0 | 0.0 |
| SN(E/C) |
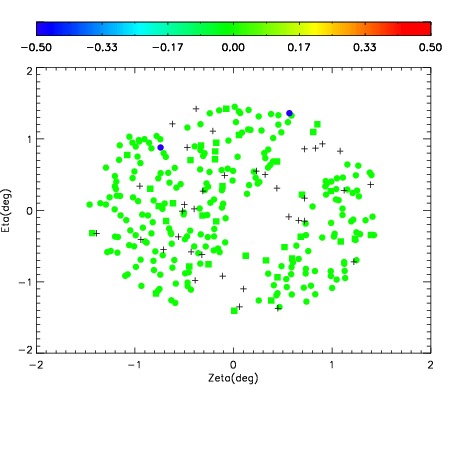
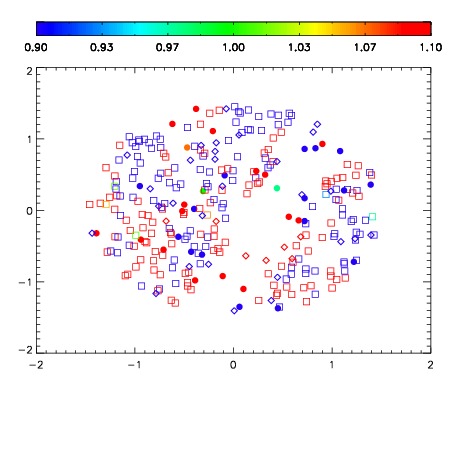
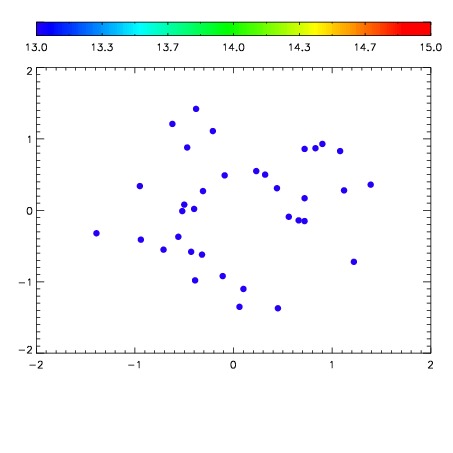

| Frame | Nreads | Zeropoints | Mag plots | Spatial mag deviation | Spatial sky 16325A emission deviations (filled: sky, open: star) | Spatial sky continuum emission | Spatial sky telluric CO2 absorption deviations (filled: H < 10) | |||||||||||||||||||||||
| 0 | 0 |
|
|
|
|
|
|
| IPAIR | NAME | SHIFT | NEWSHIFT | S/N | NAME | SHIFT | NEWSHIFT | S/N |
| 0 | 11180028 | 0.477990 | 0.00000 | 184.028 | 11180029 | -0.00268058 | 0.480671 | 151.809 |
| 1 | 11180027 | 0.477135 | 0.000854999 | 223.499 | 11180026 | -0.00185267 | 0.479843 | 220.120 |
| 2 | 11180024 | 0.477129 | 0.000860989 | 220.508 | 11180025 | -0.00211845 | 0.480108 | 219.244 |
| 3 | 11180023 | 0.476847 | 0.00114301 | 218.209 | 11180022 | 0.00000 | 0.477990 | 172.837 |