| Red | Green | Blue | |
| z | 17.64 | ||
| znorm | Inf | ||
| sky | -Inf | -Inf | -Inf |
| S/N | 25.7 | 44.9 | 51.7 |
| S/N(c) | 0.0 | 0.0 | 0.0 |
| SN(E/C) |


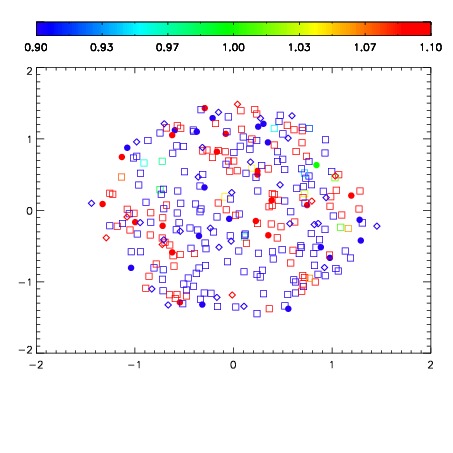
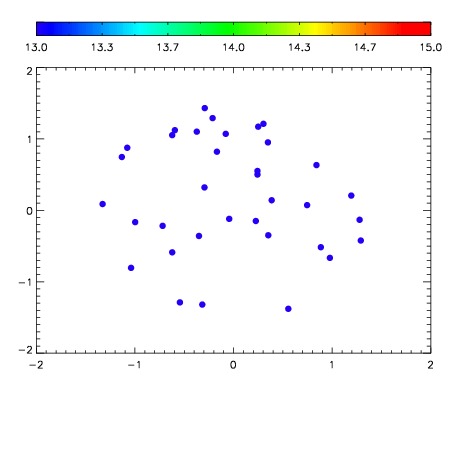

| Frame | Nreads | Zeropoints | Mag plots | Spatial mag deviation | Spatial sky 16325A emission deviations (filled: sky, open: star) | Spatial sky continuum emission | Spatial sky telluric CO2 absorption deviations (filled: H < 10) | |||||||||||||||||||||||
| 0 | 0 |
|
|
|
|
|
|
| IPAIR | NAME | SHIFT | NEWSHIFT | S/N | NAME | SHIFT | NEWSHIFT | S/N |
| 0 | 03770049 | 0.510438 | 0.00000 | 219.406 | 03770051 | -0.000131145 | 0.510569 | 212.807 |
| 1 | 03770048 | 0.509161 | 0.00127703 | 229.747 | 03770047 | 0.00000 | 0.510438 | 234.372 |
| 2 | 03770052 | 0.506056 | 0.00438201 | 223.790 | 03770050 | 0.00122844 | 0.509210 | 225.255 |
| 3 | 03770053 | 0.508111 | 0.00232702 | 211.407 | 03770054 | 0.00261398 | 0.507824 | 198.948 |