| Red | Green | Blue | |
| z | 17.64 | ||
| znorm | Inf | ||
| sky | -Inf | -Inf | -Inf |
| S/N | 24.3 | 43.7 | 48.7 |
| S/N(c) | 0.0 | 0.0 | 0.0 |
| SN(E/C) |
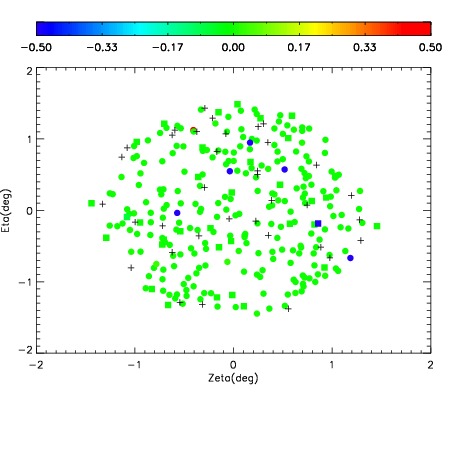
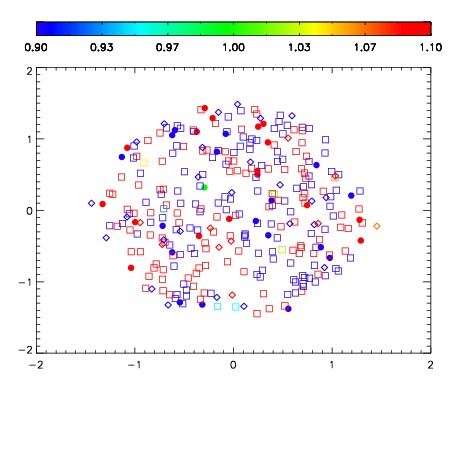
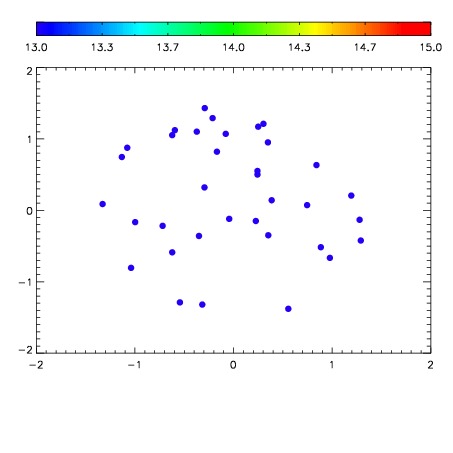

| Frame | Nreads | Zeropoints | Mag plots | Spatial mag deviation | Spatial sky 16325A emission deviations (filled: sky, open: star) | Spatial sky continuum emission | Spatial sky telluric CO2 absorption deviations (filled: H < 10) | |||||||||||||||||||||||
| 0 | 0 |
|
|
|
|
|
|
| IPAIR | NAME | SHIFT | NEWSHIFT | S/N | NAME | SHIFT | NEWSHIFT | S/N |
| 0 | 04290047 | 0.506662 | 0.00000 | 220.883 | 04290052 | 0.00319660 | 0.503465 | 226.484 |
| 1 | 04290050 | 0.503511 | 0.00315100 | 228.701 | 04290049 | -0.000998640 | 0.507661 | 226.607 |
| 2 | 04290051 | 0.505256 | 0.00140601 | 220.873 | 04290048 | 0.000607742 | 0.506054 | 225.904 |
| 3 | 04290046 | 0.505624 | 0.00103801 | 212.116 | 04290045 | 0.00000 | 0.506662 | 217.524 |