| Red | Green | Blue | |
| z | 17.64 | ||
| znorm | Inf | ||
| sky | -Inf | -Inf | -Inf |
| S/N | 14.6 | 27.4 | 31.6 |
| S/N(c) | 0.0 | 0.0 | 0.0 |
| SN(E/C) |
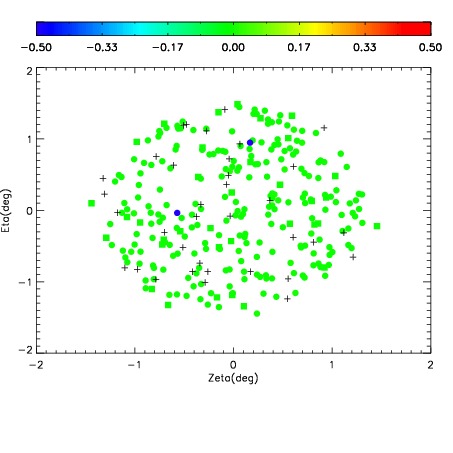
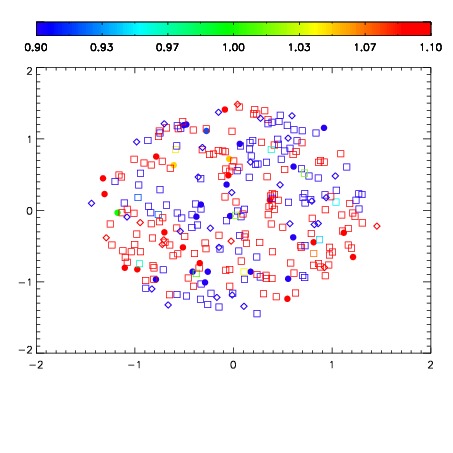
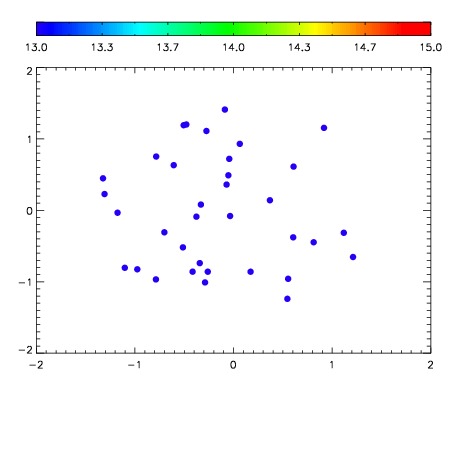

| Frame | Nreads | Zeropoints | Mag plots | Spatial mag deviation | Spatial sky 16325A emission deviations (filled: sky, open: star) | Spatial sky continuum emission | Spatial sky telluric CO2 absorption deviations (filled: H < 10) | |||||||||||||||||||||||
| 0 | 0 |
|
|
|
|
|
|
| IPAIR | NAME | SHIFT | NEWSHIFT | S/N | NAME | SHIFT | NEWSHIFT | S/N |
| 0 | 03780049 | 0.505895 | 0.00000 | 149.899 | 03780051 | 0.000264959 | 0.505630 | 133.809 |
| 1 | 03780053 | 0.505436 | 0.000459015 | 167.321 | 03780054 | 0.000650025 | 0.505245 | 150.376 |
| 2 | 03780048 | 0.505079 | 0.000816047 | 161.550 | 03780047 | 0.00000 | 0.505895 | 142.032 |
| 3 | 03780052 | 0.504399 | 0.00149602 | 120.777 | 03780050 | 0.00235132 | 0.503544 | 124.675 |