| Red | Green | Blue | |
| z | 17.64 | ||
| znorm | Inf | ||
| sky | -NaN | -Inf | -Inf |
| S/N | 20.2 | 36.6 | 39.4 |
| S/N(c) | 0.0 | 0.0 | 0.0 |
| SN(E/C) |
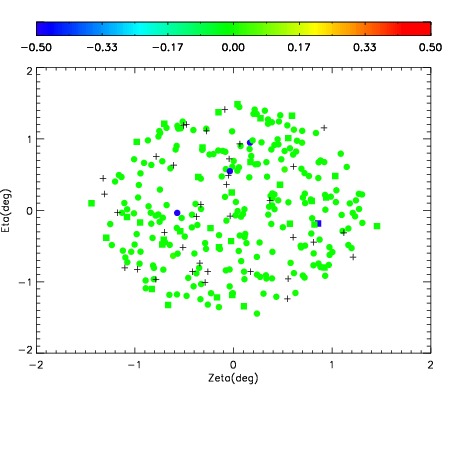
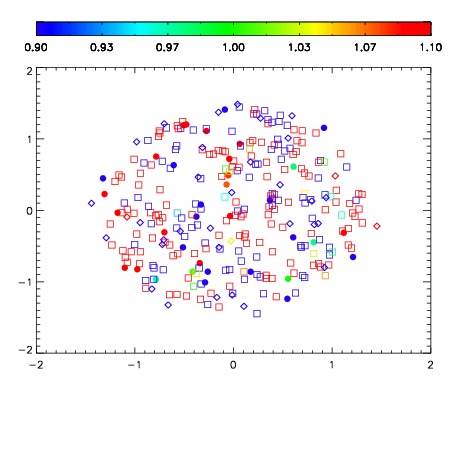


| Frame | Nreads | Zeropoints | Mag plots | Spatial mag deviation | Spatial sky 16325A emission deviations (filled: sky, open: star) | Spatial sky continuum emission | Spatial sky telluric CO2 absorption deviations (filled: H < 10) | |||||||||||||||||||||||
| 0 | 0 |
|
|
|
|
|
|
| IPAIR | NAME | SHIFT | NEWSHIFT | S/N | NAME | SHIFT | NEWSHIFT | S/N |
| 0 | 04360016 | 0.490773 | 0.00000 | 190.845 | 04360017 | 0.000999497 | 0.489773 | 175.948 |
| 1 | 04360015 | 0.488823 | 0.00195000 | 188.031 | 04360013 | 0.00116817 | 0.489605 | 175.307 |
| 2 | 04360012 | 0.489870 | 0.000902981 | 169.485 | 04360014 | -0.00211652 | 0.492890 | 167.957 |
| 3 | 04360011 | 0.488441 | 0.00233200 | 168.468 | 04360010 | 0.00000 | 0.490773 | 160.717 |