| Red | Green | Blue | |
| z | 17.64 | ||
| znorm | Inf | ||
| sky | -NaN | -NaN | -Inf |
| S/N | 30.1 | 51.2 | 56.6 |
| S/N(c) | 0.0 | 0.0 | 0.0 |
| SN(E/C) |
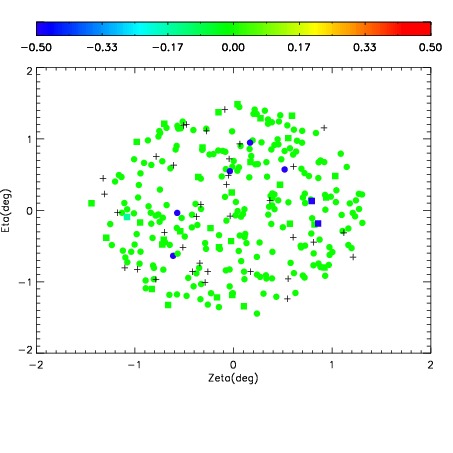
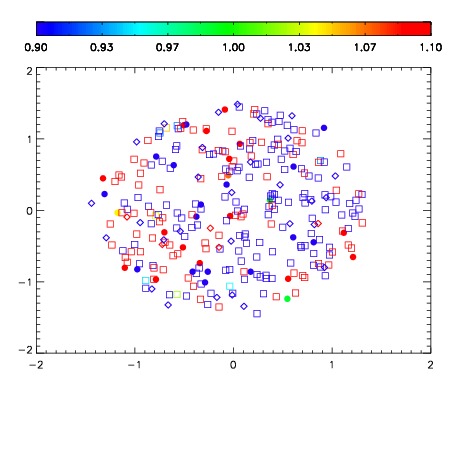


| Frame | Nreads | Zeropoints | Mag plots | Spatial mag deviation | Spatial sky 16325A emission deviations (filled: sky, open: star) | Spatial sky continuum emission | Spatial sky telluric CO2 absorption deviations (filled: H < 10) | |||||||||||||||||||||||
| 0 | 0 |
|
|
|
|
|
|
| IPAIR | NAME | SHIFT | NEWSHIFT | S/N | NAME | SHIFT | NEWSHIFT | S/N |
| 0 | 04560038 | 0.497212 | 0.00000 | 232.728 | 04560036 | 0.00000 | 0.497212 | 228.950 |
| 1 | 04560042 | 0.495033 | 0.00217900 | 235.484 | 04560039 | -0.00203172 | 0.499244 | 235.664 |
| 2 | 04560041 | 0.494327 | 0.00288498 | 235.136 | 04560040 | -0.00197213 | 0.499184 | 235.349 |
| 3 | 04560037 | 0.496580 | 0.000631988 | 234.220 | 04560043 | -0.00153402 | 0.498746 | 231.052 |