| Red | Green | Blue | |
| z | 17.64 | ||
| znorm | Inf | ||
| sky | -Inf | -Inf | -Inf |
| S/N | 19.7 | 37.6 | 40.4 |
| S/N(c) | 0.0 | 0.0 | 0.0 |
| SN(E/C) |
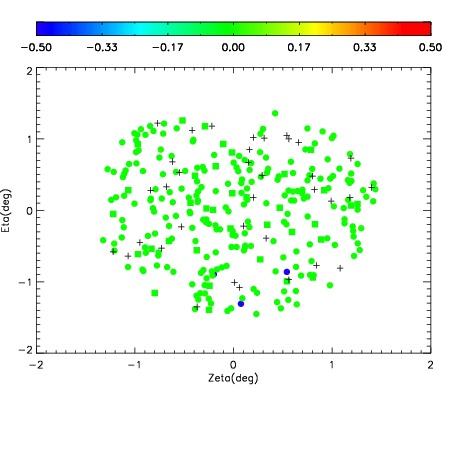

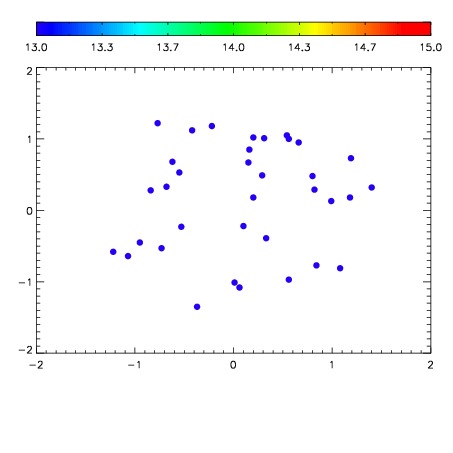

| Frame | Nreads | Zeropoints | Mag plots | Spatial mag deviation | Spatial sky 16325A emission deviations (filled: sky, open: star) | Spatial sky continuum emission | Spatial sky telluric CO2 absorption deviations (filled: H < 10) | |||||||||||||||||||||||
| 0 | 0 |
|
|
|
|
|
|
| IPAIR | NAME | SHIFT | NEWSHIFT | S/N | NAME | SHIFT | NEWSHIFT | S/N |
| 0 | 03740051 | 0.498091 | 0.00000 | 170.452 | 03740052 | 0.00253747 | 0.495554 | 160.746 |
| 1 | 03740050 | 0.495814 | 0.00227702 | 192.383 | 03740049 | -0.000327623 | 0.498419 | 194.296 |
| 2 | 03740046 | 0.494725 | 0.00336602 | 186.541 | 03740045 | 0.00000 | 0.498091 | 185.946 |
| 3 | 03740047 | 0.497997 | 9.40263e-05 | 183.457 | 03740048 | 0.00173078 | 0.496360 | 185.822 |