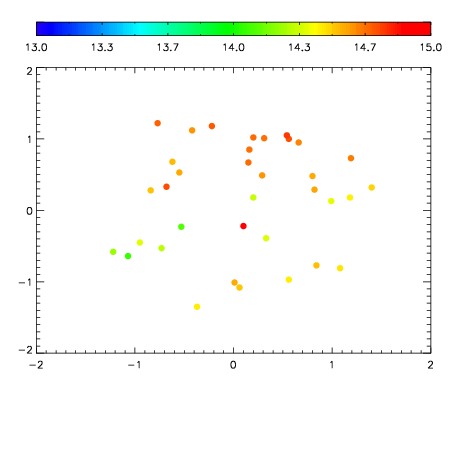
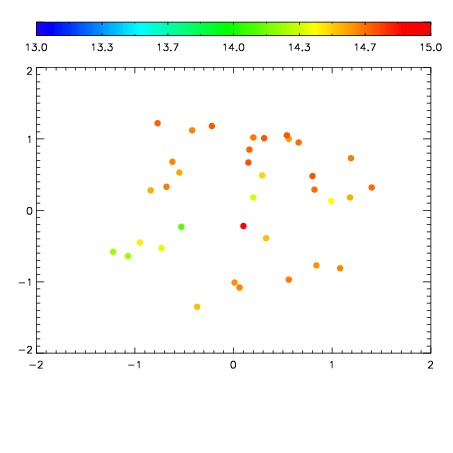
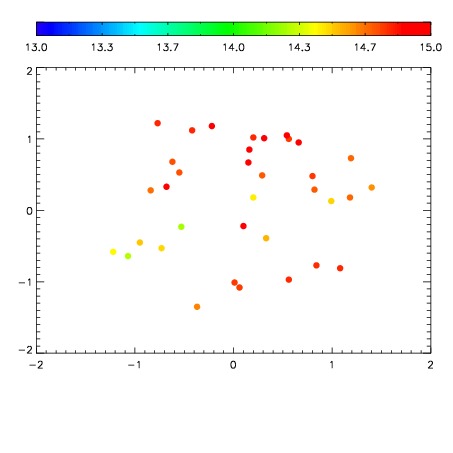
| Frame | Nreads | Zeropoints | Mag plots
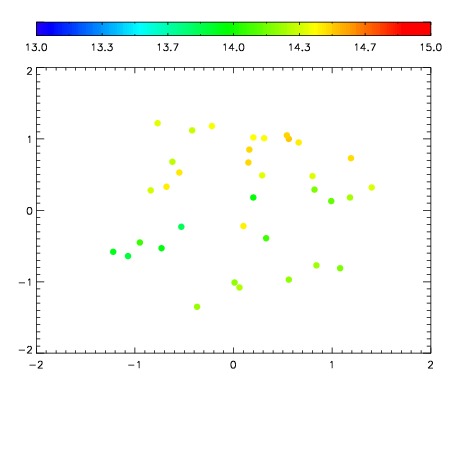
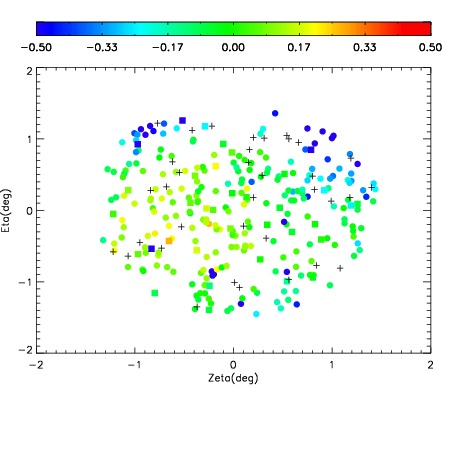
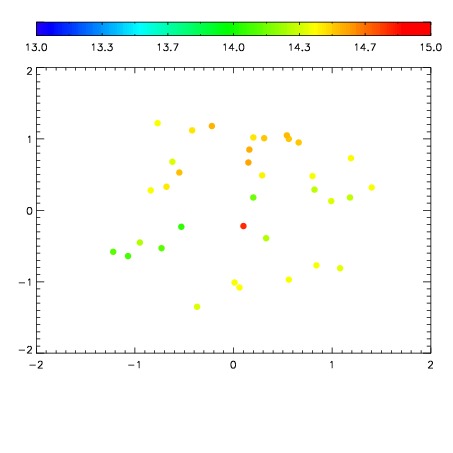
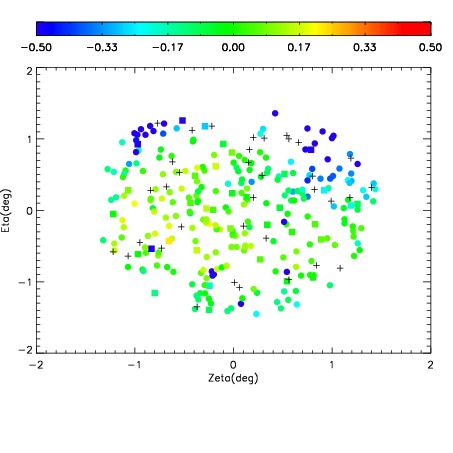
| Spatial mag deviation
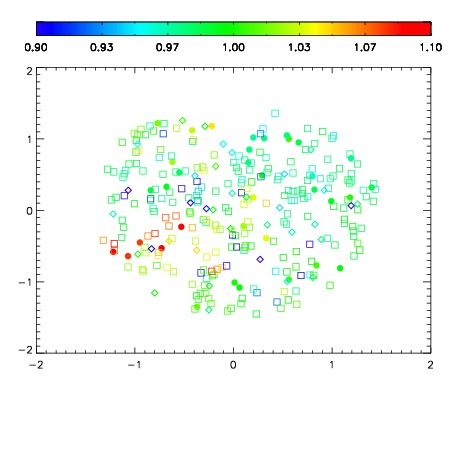
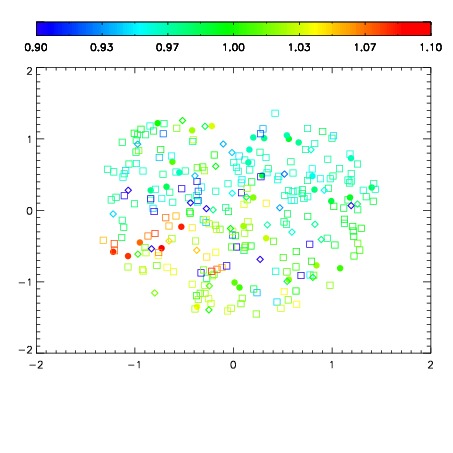
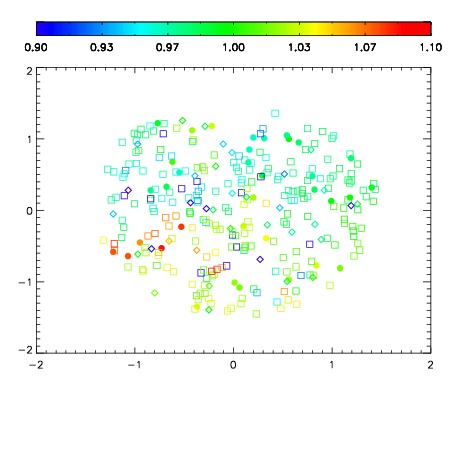
| Spatial sky 16325A emission deviations (filled: sky, open: star)
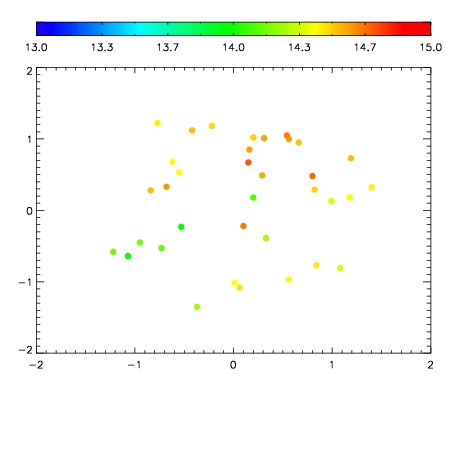
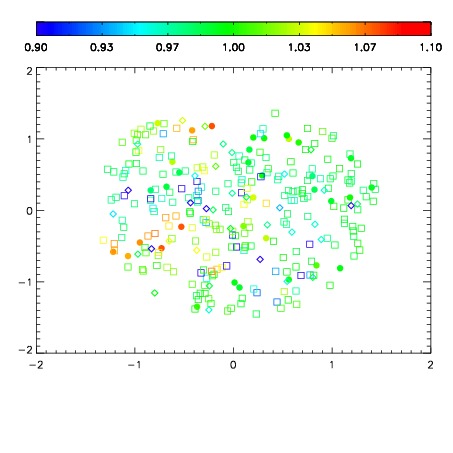
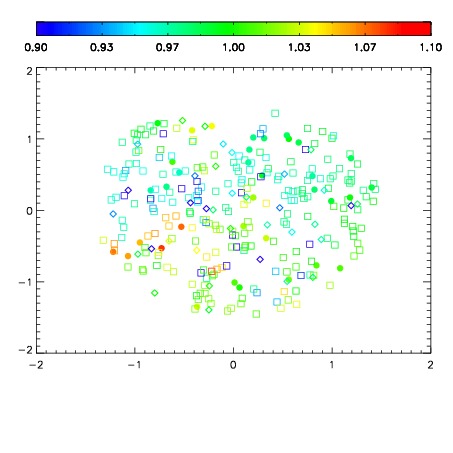
| Spatial sky continuum emission
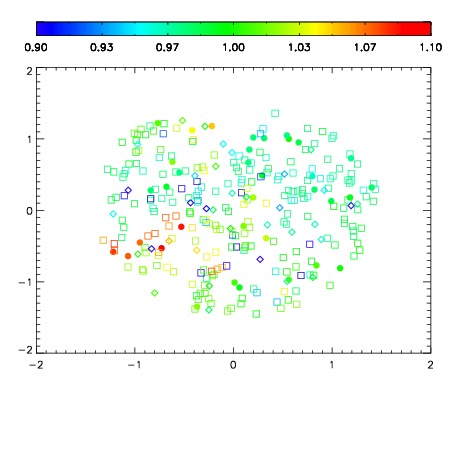
| Spatial sky telluric CO2 absorption deviations (filled: H < 10)
|
| 3750103
| 47
| | Red | Green | Blue
| | z | | 19.01
| | znorm | | 14.83
| | sky | 14.9 | 14.3 | 14.3
| | S/N | 14.8 | 24.2 | 26.9
| | S/N(c) | 12.9 | 22.5 | 25.6
| | SN(E/C) 0.36
|
| 
| 
| 
| 
| 
|
| 3750104
| 47
| | Red | Green | Blue
| | z | | 18.98
| | znorm | | 14.80
| | sky | 15.1 | 14.5 | 14.6
| | S/N | 14.4 | 23.8 | 26.5
| | S/N(c) | 12.5 | 22.4 | 25.1
| | SN(E/C) 0.37
|
| 
| 
| 
| 
| 
|
| 3750105
| 47
| | Red | Green | Blue
| | z | | 18.92
| | znorm | | 14.74
| | sky | 15.0 | 14.4 | 14.6
| | S/N | 14.0 | 22.9 | 26.0
| | S/N(c) | 12.0 | 21.6 | 24.6
| | SN(E/C) 0.37
|
| 
| 
| 
| 
| 
|
| 3750106
| 47
| | Red | Green | Blue
| | z | | 18.97
| | znorm | | 14.79
| | sky | 15.0 | 14.8 | 14.8
| | S/N | 14.3 | 23.5 | 26.3
| | S/N(c) | 12.2 | 22.2 | 24.9
| | SN(E/C) 0.37
|
| 
| 
| 
| 
| 
|
| 3750107
| 47
| | Red | Green | Blue
| | z | | 19.04
| | znorm | | 14.86
| | sky | 14.9 | 14.6 | 14.8
| | S/N | 14.6 | 24.4 | 27.1
| | S/N(c) | 12.9 | 23.0 | 25.6
| | SN(E/C) 0.35
|
| 
| 
| 
| 
| 
|
| 3750108
| 47
| | Red | Green | Blue
| | z | | 19.01
| | znorm | | 14.83
| | sky | 14.8 | 14.7 | 14.7
| | S/N | 14.5 | 23.9 | 26.7
| | S/N(c) | 12.6 | 22.6 | 25.5
| | SN(E/C) 0.36
|
| 
| 
| 
| 
| 
|
| 3750109
| 47
| | Red | Green | Blue
| | z | | 19.04
| | znorm | | 14.86
| | sky | 15.0 | 14.6 | 14.8
| | S/N | 14.6 | 24.2 | 26.9
| | S/N(c) | 12.7 | 22.9 | 25.5
| | SN(E/C) 0.34
|
| 
| 
| 
| 
| 
|
| 3750110
| 47
| | Red | Green | Blue
| | z | | 19.00
| | znorm | | 14.82
| | sky | 15.1 | 14.8 | 14.7
| | S/N | 14.0 | 23.9 | 26.0
| | S/N(c) | 12.2 | 22.5 | 24.6
| | SN(E/C) 0.36
|
| 
| 
| 
| 
| 
|