| Red | Green | Blue | |
| z | 17.64 | ||
| znorm | Inf | ||
| sky | -Inf | -Inf | -Inf |
| S/N | 24.9 | 45.0 | 50.5 |
| S/N(c) | 0.0 | 0.0 | 0.0 |
| SN(E/C) |
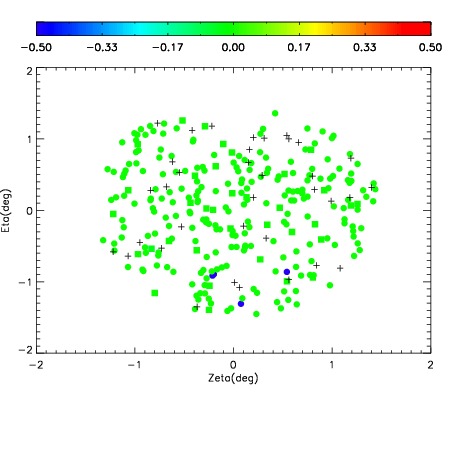
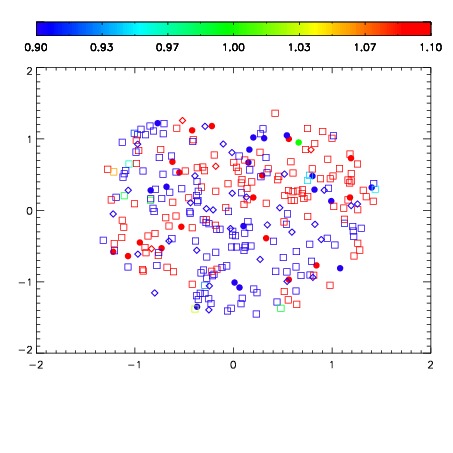
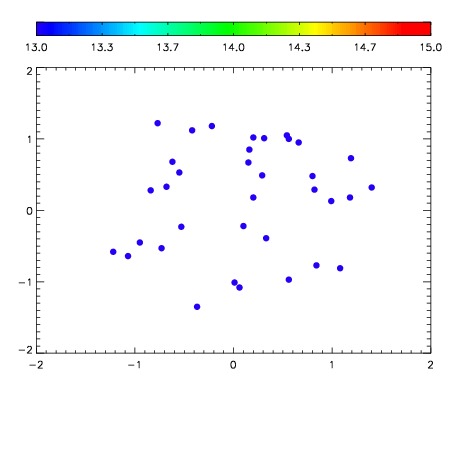

| Frame | Nreads | Zeropoints | Mag plots | Spatial mag deviation | Spatial sky 16325A emission deviations (filled: sky, open: star) | Spatial sky continuum emission | Spatial sky telluric CO2 absorption deviations (filled: H < 10) | |||||||||||||||||||||||
| 0 | 0 |
|
|
|
|
|
|
| IPAIR | NAME | SHIFT | NEWSHIFT | S/N | NAME | SHIFT | NEWSHIFT | S/N |
| 0 | 03750109 | 0.506705 | 0.00000 | 218.276 | 03750107 | -0.000675567 | 0.507381 | 218.295 |
| 1 | 03750108 | 0.504825 | 0.00187999 | 215.819 | 03750103 | 0.00000 | 0.506705 | 216.000 |
| 2 | 03750104 | 0.501866 | 0.00483900 | 214.028 | 03750110 | 0.00407925 | 0.502626 | 214.838 |
| 3 | 03750105 | 0.503071 | 0.00363398 | 207.158 | 03750106 | 0.00276782 | 0.503937 | 212.541 |