| Red | Green | Blue | |
| z | 17.64 | ||
| znorm | Inf | ||
| sky | -Inf | -Inf | -Inf |
| S/N | 26.2 | 43.7 | 51.9 |
| S/N(c) | 0.0 | 0.0 | 0.0 |
| SN(E/C) |
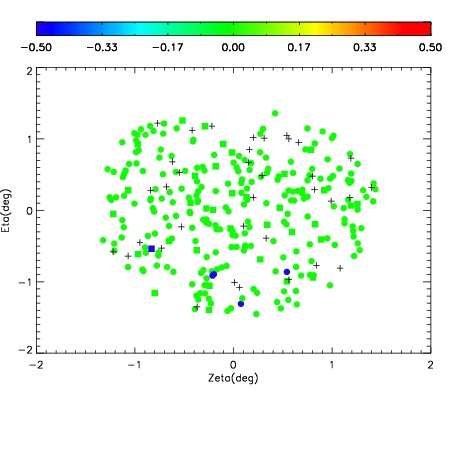
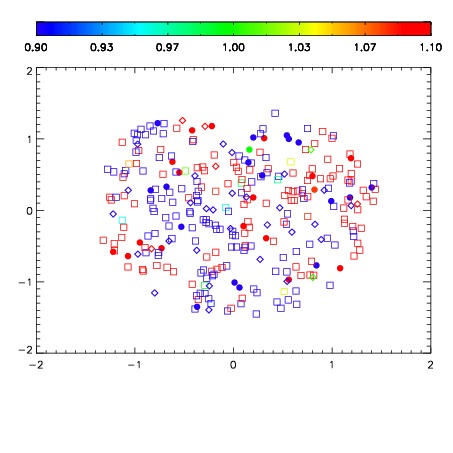
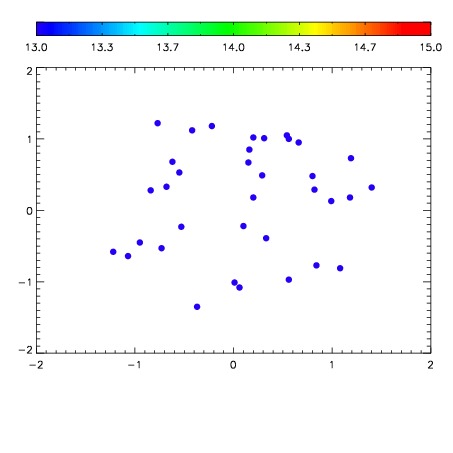

| Frame | Nreads | Zeropoints | Mag plots | Spatial mag deviation | Spatial sky 16325A emission deviations (filled: sky, open: star) | Spatial sky continuum emission | Spatial sky telluric CO2 absorption deviations (filled: H < 10) | |||||||||||||||||||||||
| 0 | 0 |
|
|
|
|
|
|
| IPAIR | NAME | SHIFT | NEWSHIFT | S/N | NAME | SHIFT | NEWSHIFT | S/N |
| 0 | 04290058 | 0.506359 | 0.00000 | 222.514 | 04290060 | 0.00103913 | 0.505320 | 219.655 |
| 1 | 04290062 | 0.505382 | 0.000976980 | 228.058 | 04290063 | 0.00269167 | 0.503667 | 229.621 |
| 2 | 04290061 | 0.504877 | 0.00148201 | 217.776 | 04290056 | 0.00000 | 0.506359 | 215.170 |
| 3 | 04290057 | 0.504831 | 0.00152797 | 214.562 | 04290059 | 0.00140954 | 0.504949 | 214.655 |