| Red | Green | Blue | |
| z | 17.64 | ||
| znorm | Inf | ||
| sky | -Inf | -Inf | -Inf |
| S/N | 27.2 | 50.1 | 56.3 |
| S/N(c) | 0.0 | 0.0 | 0.0 |
| SN(E/C) |
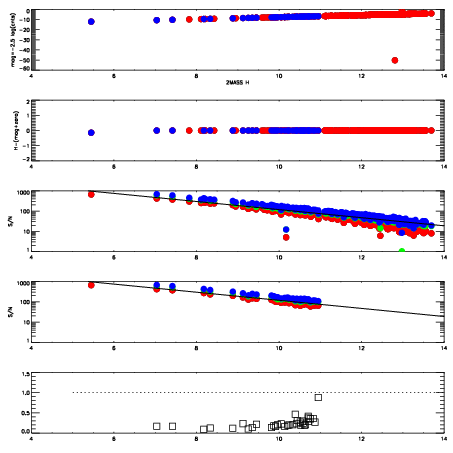

| Frame | Nreads | Zeropoints | Mag plots | Spatial mag deviation | Spatial sky 16325A emission deviations (filled: sky, open: star) | Spatial sky continuum emission | Spatial sky telluric CO2 absorption deviations (filled: H < 10) | |||||||||||||||||||||||
| 0 | 0 |
|
|
|
|
|
|
| IPAIR | NAME | SHIFT | NEWSHIFT | S/N | NAME | SHIFT | NEWSHIFT | S/N |
| 0 | 04560049 | 0.497751 | 0.00000 | 201.888 | 04560051 | 0.00126840 | 0.496483 | 202.721 |
| 1 | 04560048 | 0.497135 | 0.000615984 | 203.922 | 04560047 | 0.00000 | 0.497751 | 202.777 |
| 2 | 04560052 | 0.497496 | 0.000254989 | 199.382 | 04560050 | 0.000974759 | 0.496776 | 202.380 |
| 3 | 04560053 | 0.497727 | 2.39909e-05 | 197.395 | 04560054 | 0.00140330 | 0.496348 | 200.063 |