| Red | Green | Blue | |
| z | 17.64 | ||
| znorm | Inf | ||
| sky | -Inf | -Inf | -Inf |
| S/N | 25.7 | 47.1 | 50.8 |
| S/N(c) | 0.0 | 0.0 | 0.0 |
| SN(E/C) |
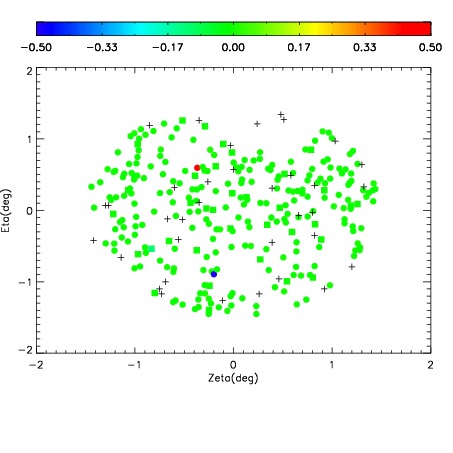
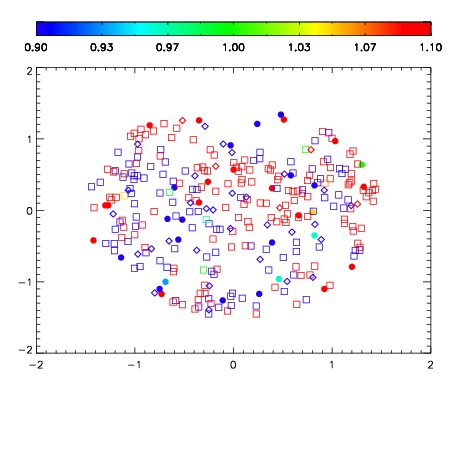
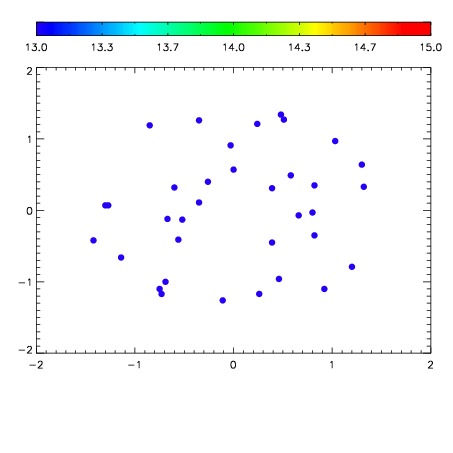

| Frame | Nreads | Zeropoints | Mag plots | Spatial mag deviation | Spatial sky 16325A emission deviations (filled: sky, open: star) | Spatial sky continuum emission | Spatial sky telluric CO2 absorption deviations (filled: H < 10) | |||||||||||||||||||||||
| 0 | 0 |
|
|
|
|
|
|
| IPAIR | NAME | SHIFT | NEWSHIFT | S/N | NAME | SHIFT | NEWSHIFT | S/N |
| 0 | 04860034 | 0.495107 | 0.00000 | 204.837 | 04860032 | 0.00129084 | 0.493816 | 204.976 |
| 1 | 04860030 | 0.491999 | 0.00310799 | 207.164 | 04860031 | 0.00445831 | 0.490649 | 205.676 |
| 2 | 04860029 | 0.492541 | 0.00256601 | 204.586 | 04860035 | 0.000709495 | 0.494397 | 202.801 |
| 3 | 04860033 | 0.493633 | 0.00147399 | 201.982 | 04860028 | 0.00000 | 0.495107 | 201.299 |