| Red | Green | Blue | |
| z | 17.64 | ||
| znorm | Inf | ||
| sky | -Inf | -Inf | -Inf |
| S/N | 9.9 | 22.1 | 24.3 |
| S/N(c) | 0.0 | 0.0 | 0.0 |
| SN(E/C) |
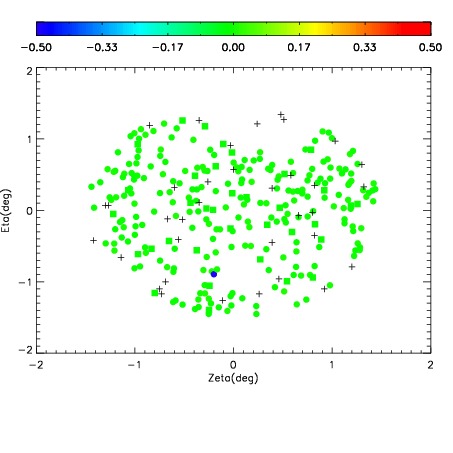


| Frame | Nreads | Zeropoints | Mag plots | Spatial mag deviation | Spatial sky 16325A emission deviations (filled: sky, open: star) | Spatial sky continuum emission | Spatial sky telluric CO2 absorption deviations (filled: H < 10) | |||||||||||||||||||||||
| 0 | 0 |
|
|
|
|
|
|
| IPAIR | NAME | SHIFT | NEWSHIFT | S/N | NAME | SHIFT | NEWSHIFT | S/N |
| 0 | 08130022 | 0.513317 | 0.00000 | 113.126 | 08130023 | 0.00153977 | 0.511777 | 105.699 |
| 1 | 08130021 | 0.508159 | 0.00515801 | 119.665 | 08130020 | -0.000816305 | 0.514133 | 117.095 |
| 2 | 08130017 | 0.510479 | 0.00283802 | 106.851 | 08130019 | -0.00175475 | 0.515072 | 103.751 |
| 3 | 08130018 | 0.512426 | 0.000890970 | 96.0697 | 08130016 | 0.00000 | 0.513317 | 82.4177 |