| Red | Green | Blue | |
| z | 17.64 | ||
| znorm | Inf | ||
| sky | -NaN | -Inf | -Inf |
| S/N | 27.5 | 48.4 | 54.7 |
| S/N(c) | 0.0 | 0.0 | 0.0 |
| SN(E/C) |
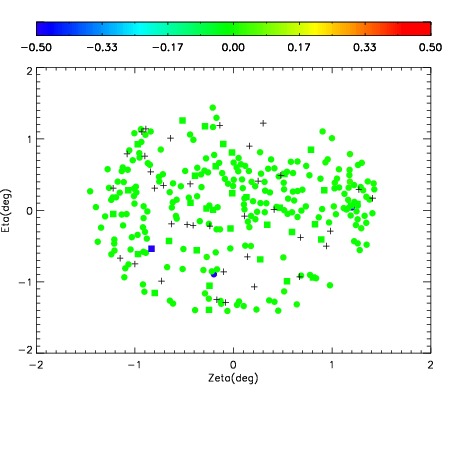
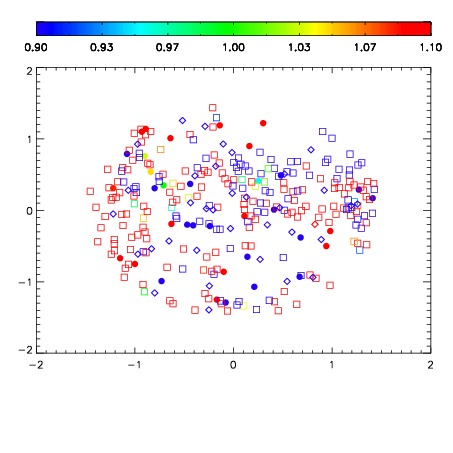
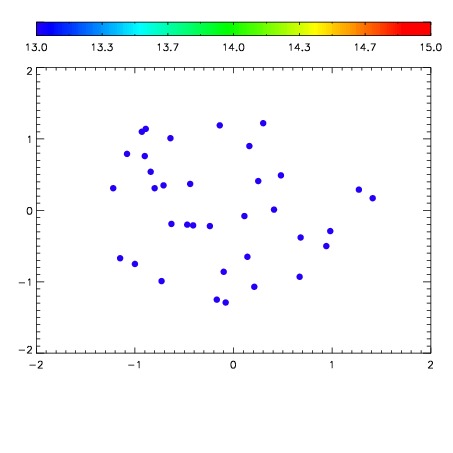

| Frame | Nreads | Zeropoints | Mag plots | Spatial mag deviation | Spatial sky 16325A emission deviations (filled: sky, open: star) | Spatial sky continuum emission | Spatial sky telluric CO2 absorption deviations (filled: H < 10) | |||||||||||||||||||||||
| 0 | 0 |
|
|
|
|
|
|
| IPAIR | NAME | SHIFT | NEWSHIFT | S/N | NAME | SHIFT | NEWSHIFT | S/N |
| 0 | 04650027 | 0.490276 | 0.00000 | 192.018 | 04650028 | 0.00203005 | 0.488246 | 188.370 |
| 1 | 04650026 | 0.488951 | 0.00132501 | 187.697 | 04650029 | 0.00268908 | 0.487587 | 187.052 |
| 2 | 04650031 | 0.489933 | 0.000342995 | 186.405 | 04650025 | 0.00000 | 0.490276 | 185.875 |
| 3 | 04650030 | 0.488691 | 0.00158501 | 178.142 | 04650032 | 0.00394493 | 0.486331 | 183.711 |