| Red | Green | Blue | |
| z | 17.64 | ||
| znorm | Inf | ||
| sky | -Inf | -Inf | -Inf |
| S/N | 25.1 | 44.4 | 50.0 |
| S/N(c) | 0.0 | 0.0 | 0.0 |
| SN(E/C) |
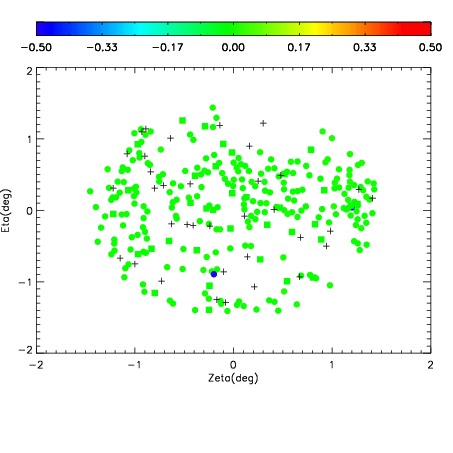
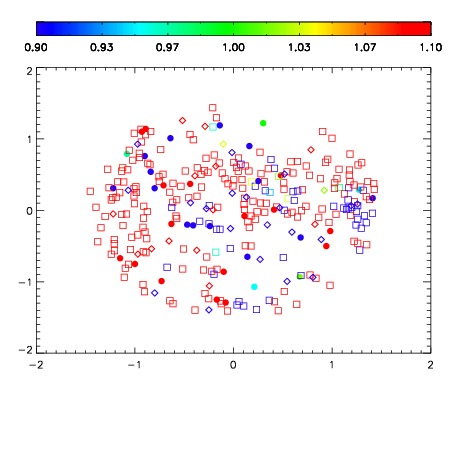
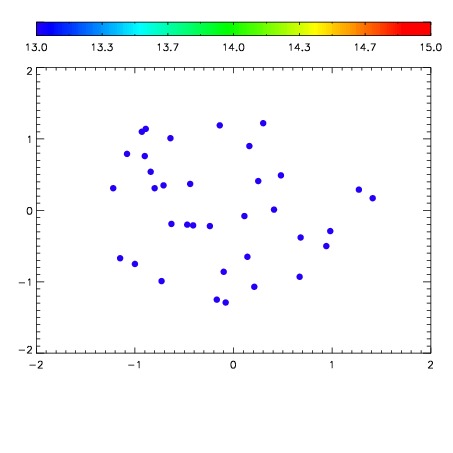

| Frame | Nreads | Zeropoints | Mag plots | Spatial mag deviation | Spatial sky 16325A emission deviations (filled: sky, open: star) | Spatial sky continuum emission | Spatial sky telluric CO2 absorption deviations (filled: H < 10) | |||||||||||||||||||||||
| 0 | 0 |
|
|
|
|
|
|
| IPAIR | NAME | SHIFT | NEWSHIFT | S/N | NAME | SHIFT | NEWSHIFT | S/N |
| 0 | 04900038 | 0.486353 | 0.00000 | 173.777 | 04900043 | 0.00280273 | 0.483550 | 168.300 |
| 1 | 04900041 | 0.484417 | 0.00193602 | 177.180 | 04900040 | 0.00255001 | 0.483803 | 182.821 |
| 2 | 04900042 | 0.485160 | 0.00119302 | 175.461 | 04900039 | 0.000421852 | 0.485931 | 178.600 |
| 3 | 04900037 | 0.486180 | 0.000173002 | 172.099 | 04900036 | 0.00000 | 0.486353 | 166.433 |