| Red | Green | Blue | |
| z | 17.64 | ||
| znorm | Inf | ||
| sky | -Inf | -Inf | -Inf |
| S/N | 14.8 | 27.8 | 27.9 |
| S/N(c) | 0.0 | 0.0 | 0.0 |
| SN(E/C) |

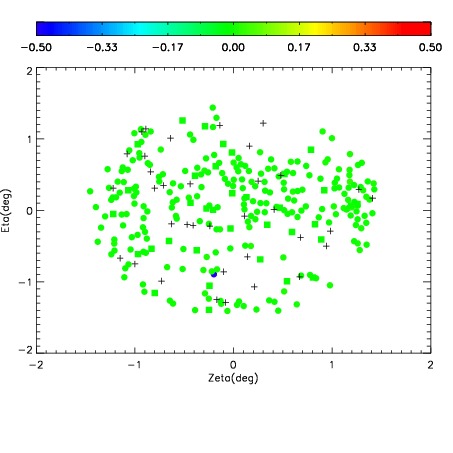
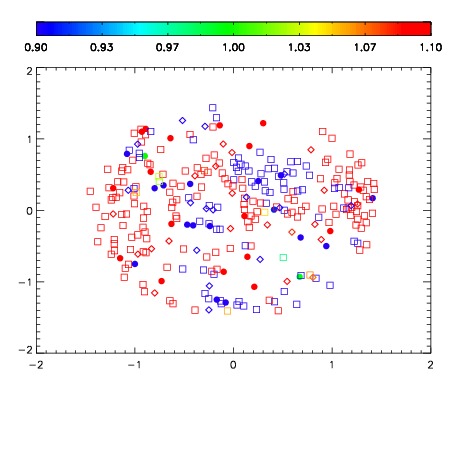
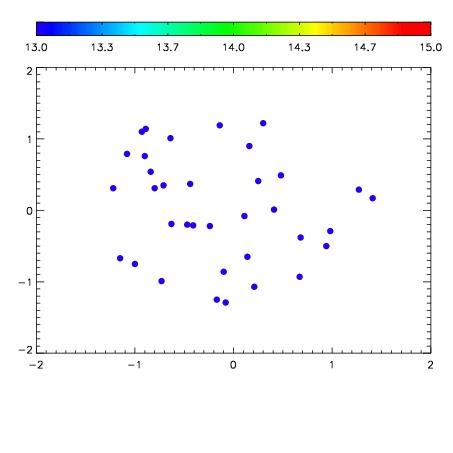

| Frame | Nreads | Zeropoints | Mag plots | Spatial mag deviation | Spatial sky 16325A emission deviations (filled: sky, open: star) | Spatial sky continuum emission | Spatial sky telluric CO2 absorption deviations (filled: H < 10) | |||||||||||||||||||||||
| 0 | 0 |
|
|
|
|
|
|
| IPAIR | NAME | SHIFT | NEWSHIFT | S/N | NAME | SHIFT | NEWSHIFT | S/N |
| 0 | 05170017 | 0.500791 | 0.00000 | 122.853 | 05170014 | 0.00107884 | 0.499712 | 131.979 |
| 1 | 05170012 | 0.498626 | 0.00216502 | 120.024 | 05170015 | 0.000703247 | 0.500088 | 129.963 |
| 2 | 05170013 | 0.498919 | 0.00187200 | 118.688 | 05170011 | 0.00000 | 0.500791 | 120.265 |
| 3 | 05170016 | 0.498952 | 0.00183901 | 116.587 | 05170018 | 0.00422270 | 0.496568 | 114.720 |