| Red | Green | Blue | |
| z | 17.64 | ||
| znorm | Inf | ||
| sky | -Inf | -Inf | -Inf |
| S/N | 22.8 | 41.1 | 44.6 |
| S/N(c) | 0.0 | 0.0 | 0.0 |
| SN(E/C) |
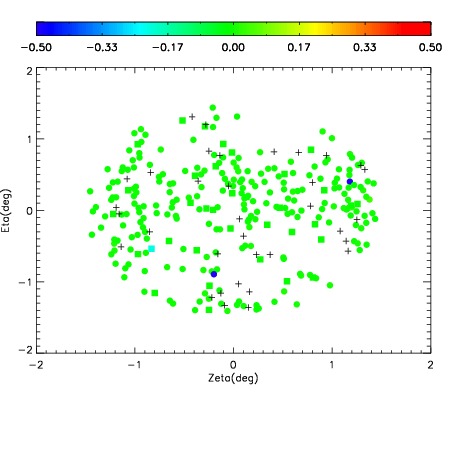
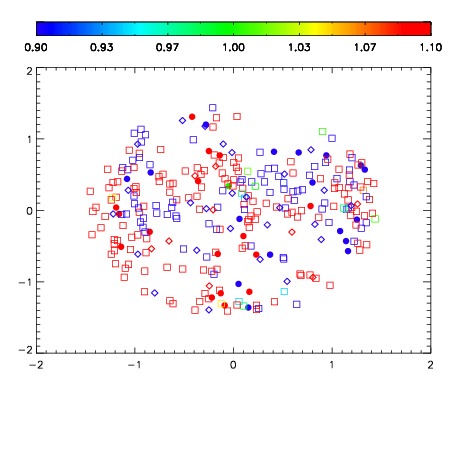
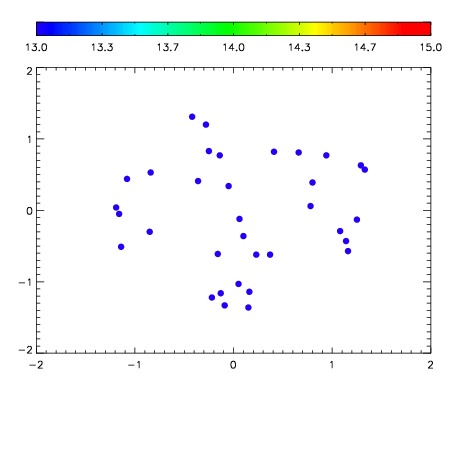

| Frame | Nreads | Zeropoints | Mag plots | Spatial mag deviation | Spatial sky 16325A emission deviations (filled: sky, open: star) | Spatial sky continuum emission | Spatial sky telluric CO2 absorption deviations (filled: H < 10) | |||||||||||||||||||||||
| 0 | 0 |
|
|
|
|
|
|
| IPAIR | NAME | SHIFT | NEWSHIFT | S/N | NAME | SHIFT | NEWSHIFT | S/N |
| 0 | 05220016 | 0.501684 | 0.00000 | 165.890 | 05220010 | 0.00000 | 0.501684 | 137.101 |
| 1 | 05220015 | 0.501045 | 0.000639021 | 173.473 | 05220014 | 0.00135750 | 0.500327 | 170.133 |
| 2 | 05220011 | 0.499241 | 0.00244302 | 168.403 | 05220017 | 0.00303519 | 0.498649 | 163.683 |
| 3 | 05220012 | 0.499772 | 0.00191200 | 167.258 | 05220013 | 0.00286187 | 0.498822 | 156.084 |