| Frame | Nreads | Zeropoints | Mag plots
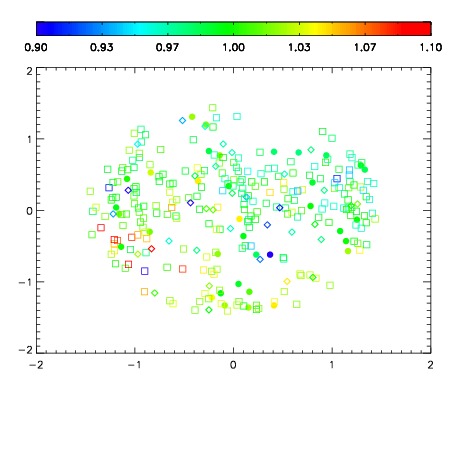
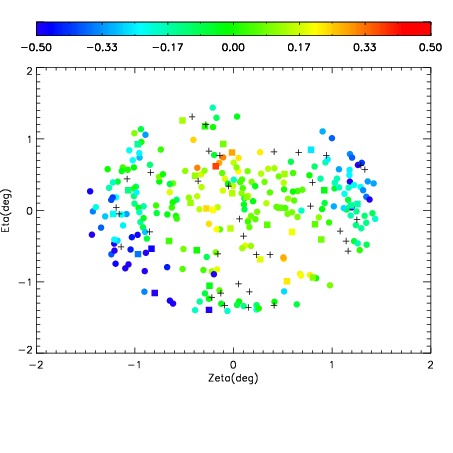
| Spatial mag deviation
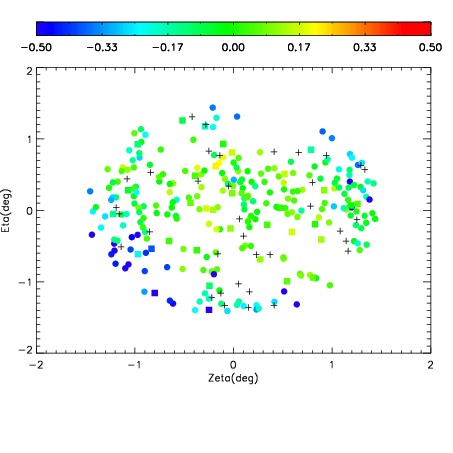
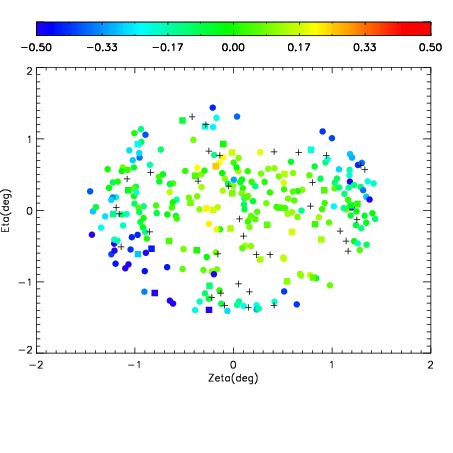
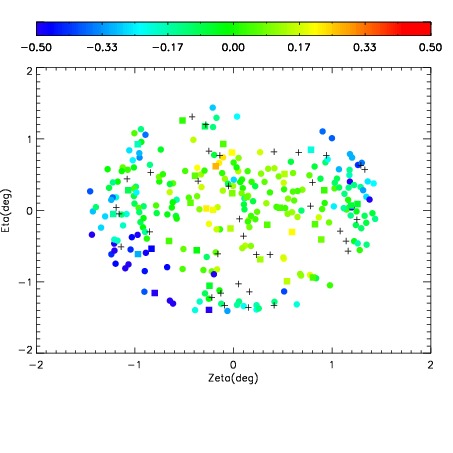
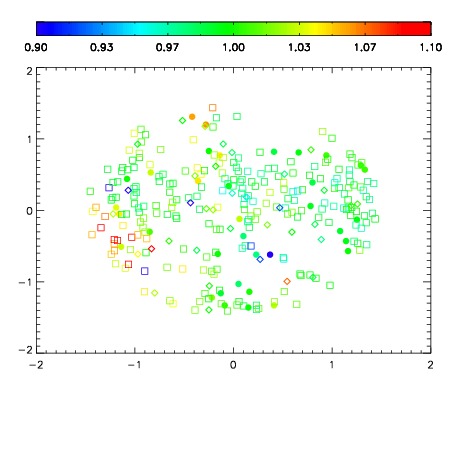
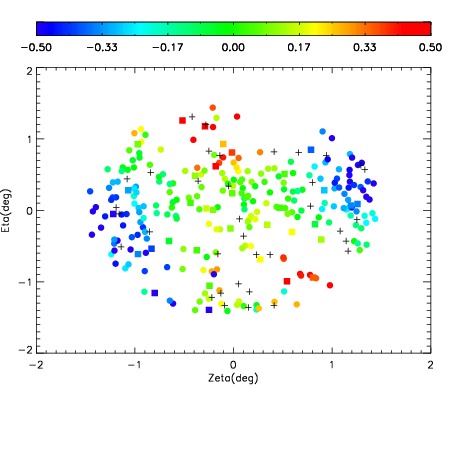
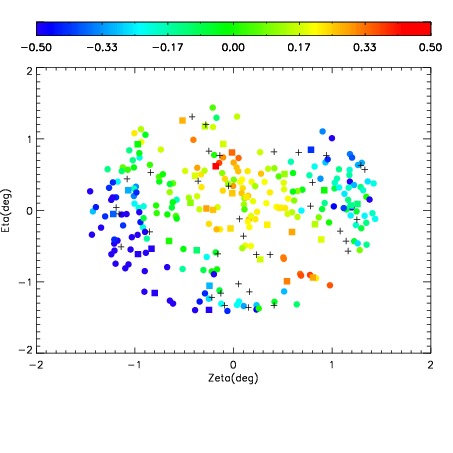
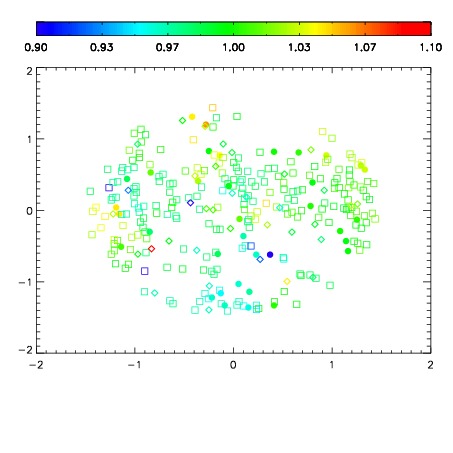
| Spatial sky 16325A emission deviations (filled: sky, open: star)
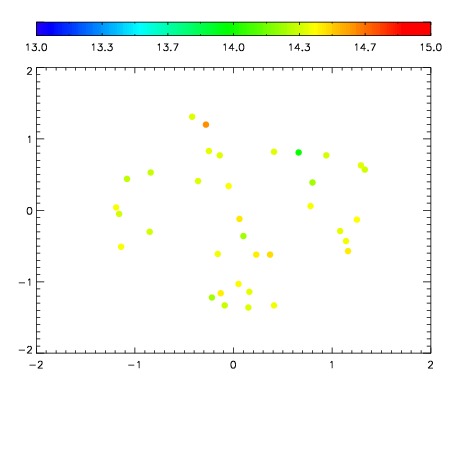
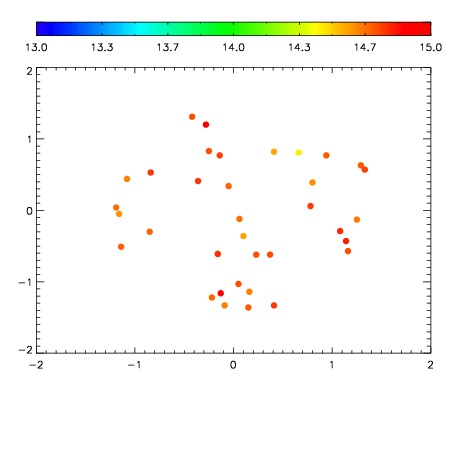
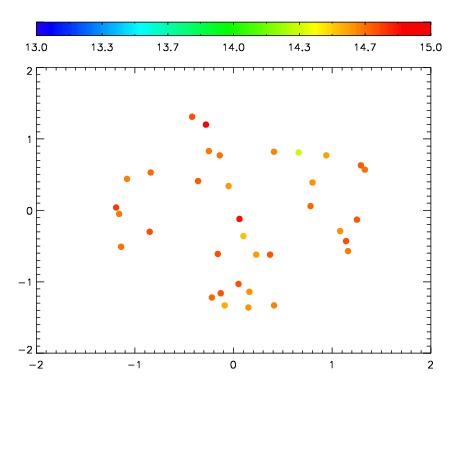
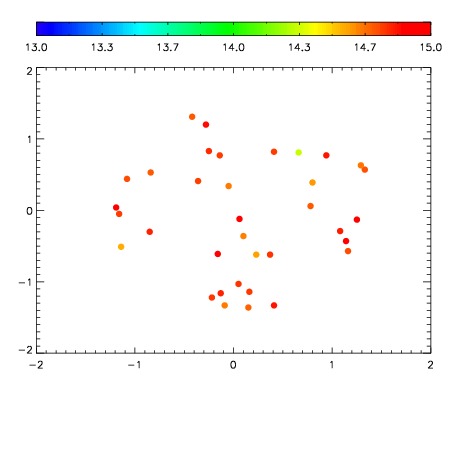
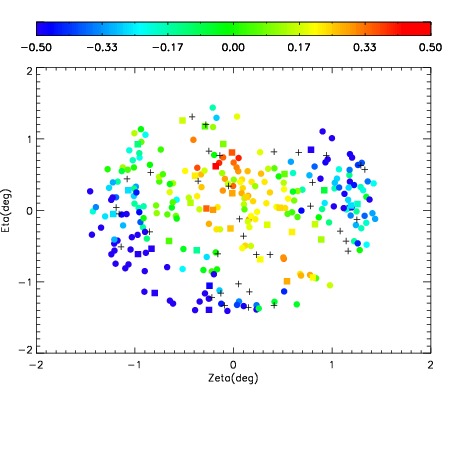
| Spatial sky continuum emission
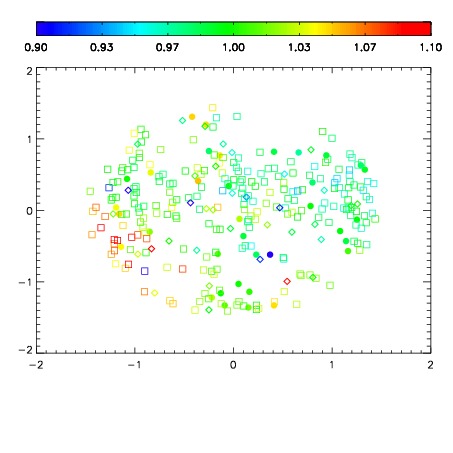
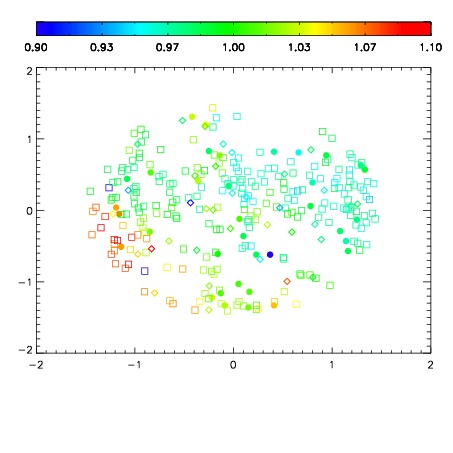
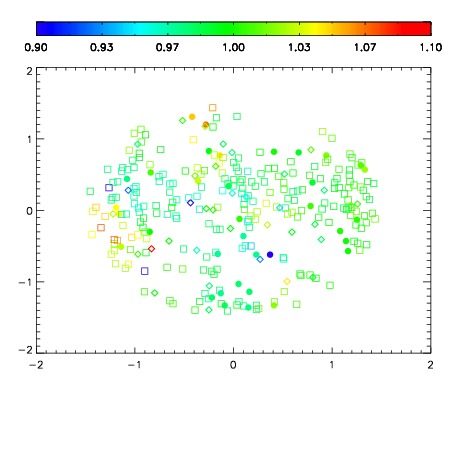
| Spatial sky telluric CO2 absorption deviations (filled: H < 10)
|
| 5480010
| 47
| | Red | Green | Blue
| | z | | 18.75
| | znorm | | 14.57
| | sky | 14.5 | 14.4 | 14.3
| | S/N | 12.8 | 21.6 | 22.7
| | S/N(c) | 11.0 | 19.7 | 21.0
| | SN(E/C) 0.45
|
| 
| 
| 
| 
| 
|
| 5480011
| 47
| | Red | Green | Blue
| | z | | 18.81
| | znorm | | 14.63
| | sky | 14.7 | 14.7 | 14.8
| | S/N | 12.7 | 22.2 | 23.5
| | S/N(c) | 10.9 | 20.3 | 21.8
| | SN(E/C) 0.44
|
| 
| 
| 
| 
| 
|
| 5480012
| 47
| | Red | Green | Blue
| | z | | 18.75
| | znorm | | 14.57
| | sky | 14.7 | 14.7 | 15.1
| | S/N | 12.3 | 21.1 | 22.7
| | S/N(c) | 10.5 | 19.3 | 21.0
| | SN(E/C) 0.46
|
| 
| 
| 
| 
| 
|
| 5480013
| 47
| | Red | Green | Blue
| | z | | 18.63
| | znorm | | 14.45
| | sky | 14.6 | 14.7 | 15.0
| | S/N | 10.6 | 19.1 | 20.2
| | S/N(c) | 8.9 | 17.2 | 18.5
| | SN(E/C) 0.46
|
| 
| 
| 
| 
| 
|
| 5480014
| 47
| | Red | Green | Blue
| | z | | 18.08
| | znorm | | 13.90
| | sky | 14.5 | 14.7 | 15.2
| | S/N | 5.7 | 12.3 | 12.6
| | S/N(c) | 4.8 | 10.8 | 11.5
| | SN(E/C) 0.53
|
| 
| 
| 
| 
| 
|
| 5480015
| 47
| | Red | Green | Blue
| | z | | 18.03
| | znorm | | 13.85
| | sky | 14.6 | 14.8 | 15.3
| | S/N | 6.0 | 12.2 | 12.6
| | S/N(c) | 4.9 | 10.7 | 11.2
| | SN(E/C) 0.59
|
| 
| 
| 
| 
| 
|
| 5480016
| 47
| | Red | Green | Blue
| | z | | 18.27
| | znorm | | 14.09
| | sky | 14.7 | 14.9 | 15.2
| | S/N | 7.6 | 14.6 | 15.1
| | S/N(c) | 6.2 | 12.8 | 13.6
| | SN(E/C) 0.52
|
| 
| 
| 
| 
| 
|
| 5480017
| 47
| | Red | Green | Blue
| | z | | 18.41
| | znorm | | 14.23
| | sky | 14.4 | 14.7 | 15.2
| | S/N | 7.2 | 14.4 | 14.9
| | S/N(c) | 5.9 | 12.5 | 13.4
| | SN(E/C) 0.49
|
| 
| 
| 
| 
| 
|