| Red | Green | Blue | |
| z | 17.64 | ||
| znorm | Inf | ||
| sky | -Inf | -Inf | -Inf |
| S/N | 16.5 | 31.8 | 34.0 |
| S/N(c) | 0.0 | 0.0 | 0.0 |
| SN(E/C) |
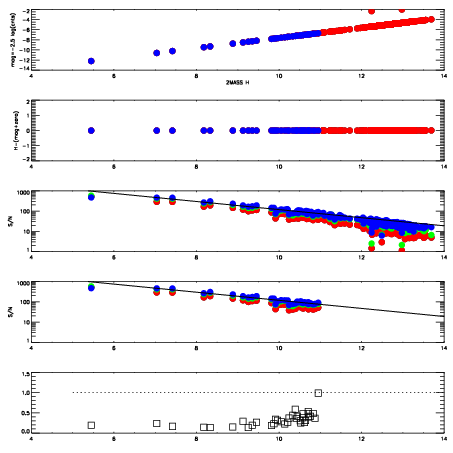

| Frame | Nreads | Zeropoints | Mag plots | Spatial mag deviation | Spatial sky 16325A emission deviations (filled: sky, open: star) | Spatial sky continuum emission | Spatial sky telluric CO2 absorption deviations (filled: H < 10) | |||||||||||||||||||||||
| 0 | 0 |
|
|
|
|
|
|
| IPAIR | NAME | SHIFT | NEWSHIFT | S/N | NAME | SHIFT | NEWSHIFT | S/N |
| 0 | 05480016 | 0.489817 | 0.00000 | 98.9188 | 05480017 | 0.00468449 | 0.485133 | 108.018 |
| 1 | 05480011 | 0.486018 | 0.00379899 | 145.085 | 05480010 | 0.00000 | 0.489817 | 141.050 |
| 2 | 05480012 | 0.486793 | 0.00302398 | 138.454 | 05480013 | 0.00101425 | 0.488803 | 127.850 |
| 3 | 05480015 | 0.488447 | 0.00136998 | 87.5993 | 05480014 | 0.000546811 | 0.489270 | 89.2971 |