| Red | Green | Blue | |
| z | 17.64 | ||
| znorm | Inf | ||
| sky | -NaN | -NaN | -Inf |
| S/N | 25.6 | 47.0 | 51.7 |
| S/N(c) | 0.0 | 0.0 | 0.0 |
| SN(E/C) |
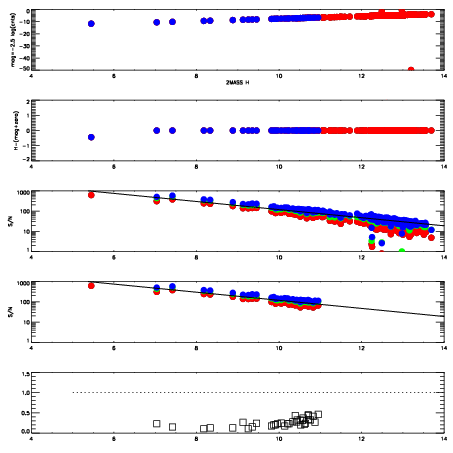
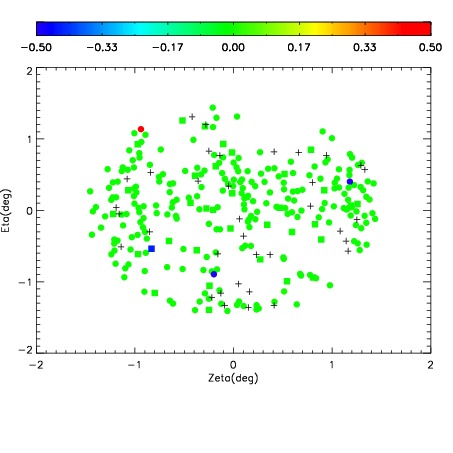
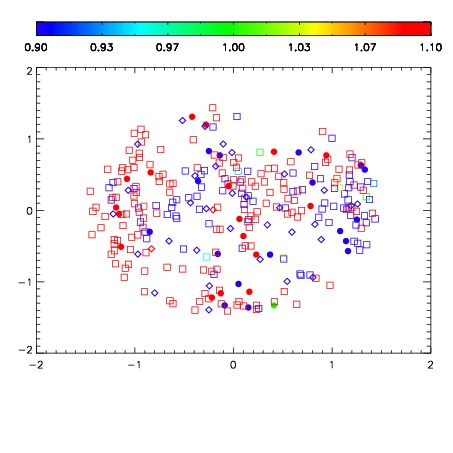
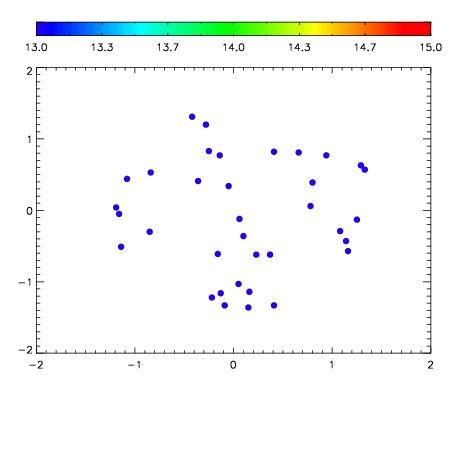

| Frame | Nreads | Zeropoints | Mag plots | Spatial mag deviation | Spatial sky 16325A emission deviations (filled: sky, open: star) | Spatial sky continuum emission | Spatial sky telluric CO2 absorption deviations (filled: H < 10) | |||||||||||||||||||||||
| 0 | 0 |
|
|
|
|
|
|
| IPAIR | NAME | SHIFT | NEWSHIFT | S/N | NAME | SHIFT | NEWSHIFT | S/N |
| 0 | 08190038 | 0.509773 | 0.00000 | 168.575 | 08190043 | -6.74778e-05 | 0.509840 | 167.474 |
| 1 | 08190037 | 0.507161 | 0.00261199 | 174.967 | 08190036 | 0.00000 | 0.509773 | 177.129 |
| 2 | 08190041 | 0.501647 | 0.00812602 | 171.530 | 08190039 | -0.000134271 | 0.509907 | 172.734 |
| 3 | 08190042 | 0.507835 | 0.00193805 | 168.382 | 08190040 | -0.000673462 | 0.510446 | 165.473 |