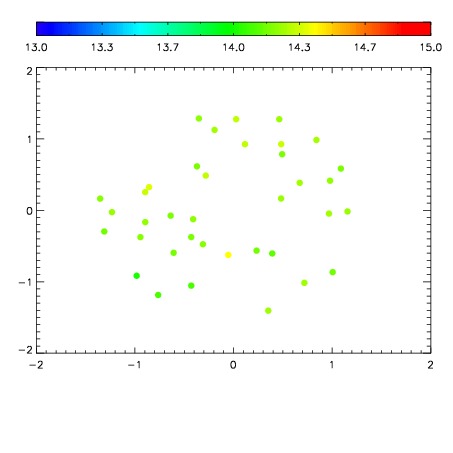
| Frame | Nreads | Zeropoints | Mag plots
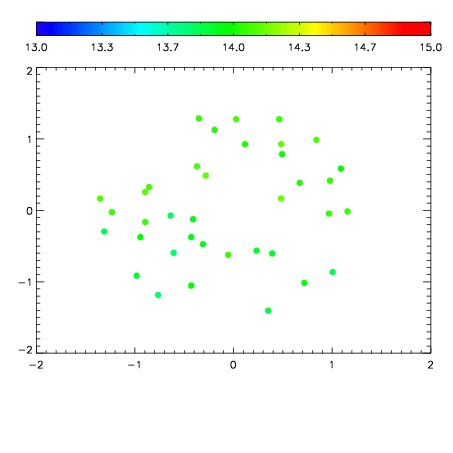
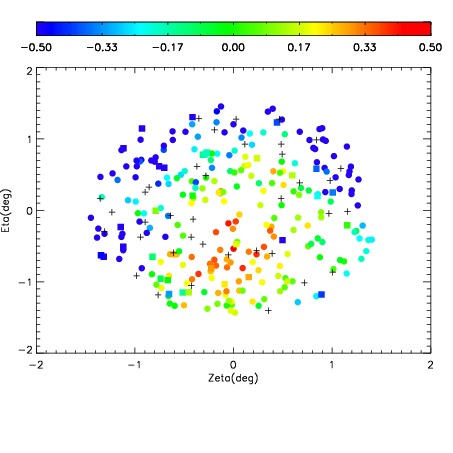
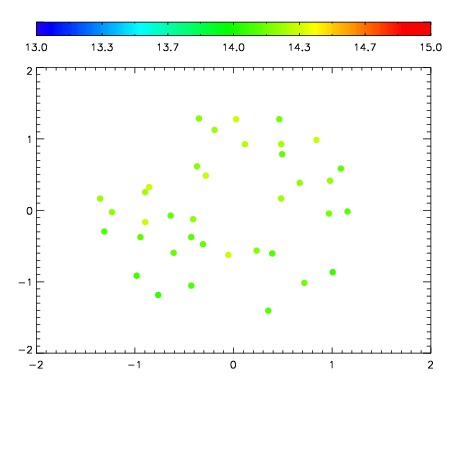
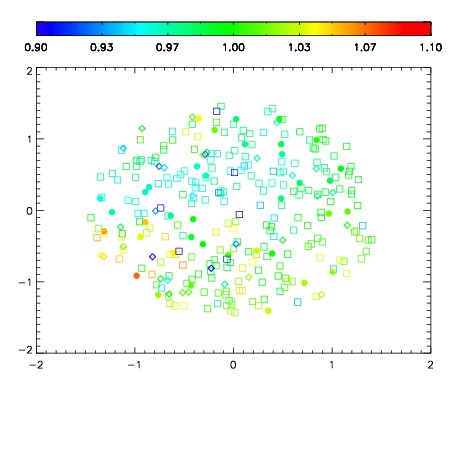
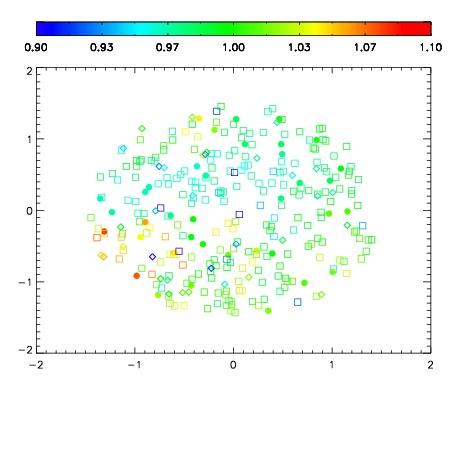
| Spatial mag deviation
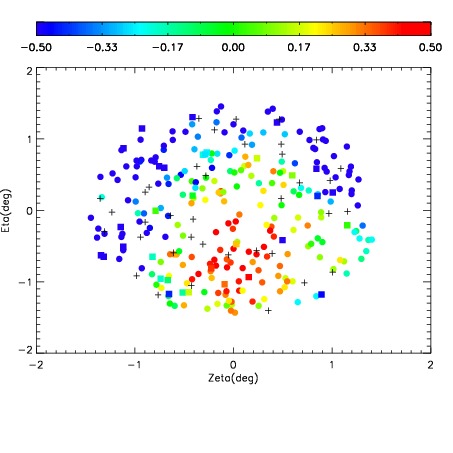
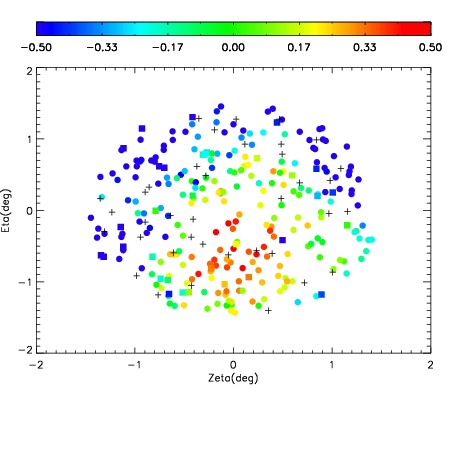
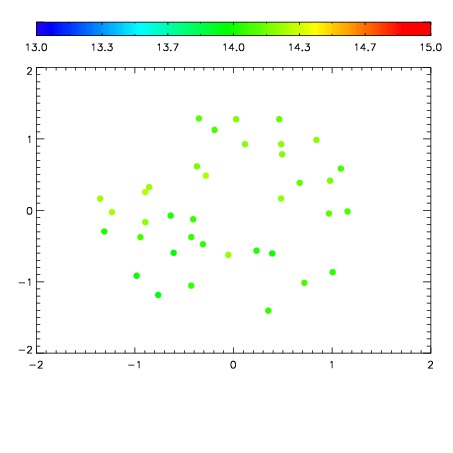
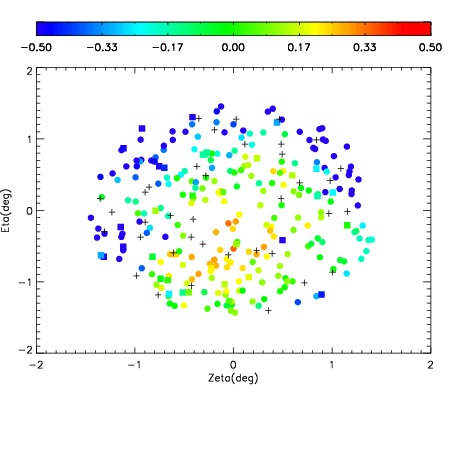
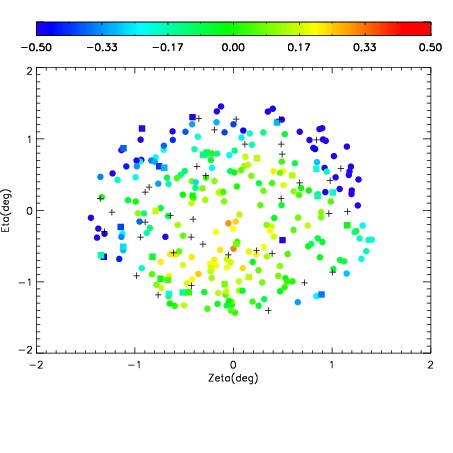
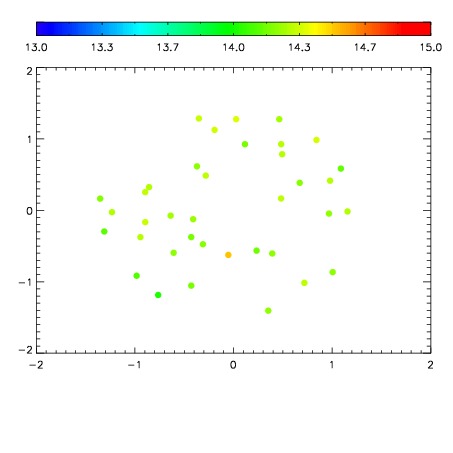
| Spatial sky 16325A emission deviations (filled: sky, open: star)
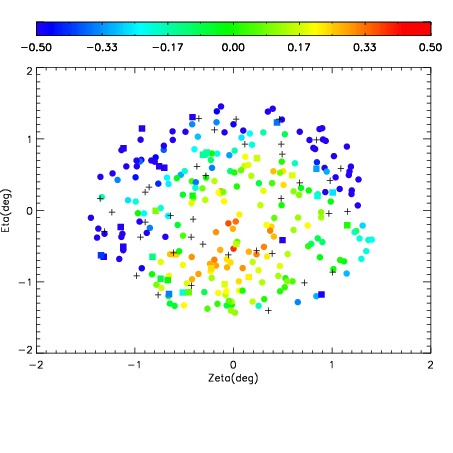
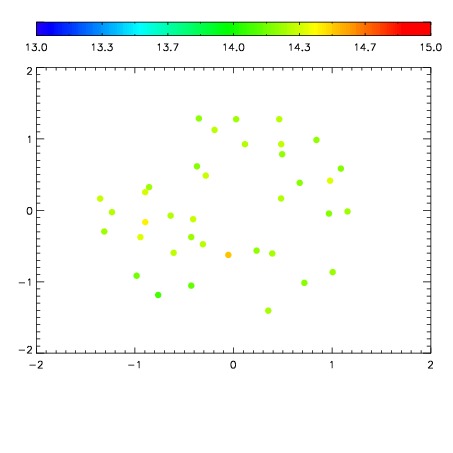
| Spatial sky continuum emission
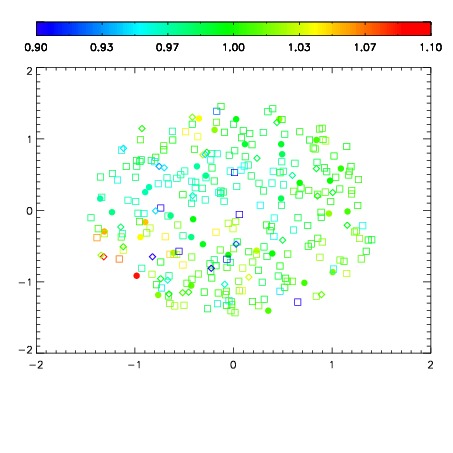
| Spatial sky telluric CO2 absorption deviations (filled: H < 10)
|
| 3720086
| 47
| | Red | Green | Blue
| | z | | 18.54
| | znorm | | 14.36
| | sky | 14.6 | 14.0 | 14.0
| | S/N | 9.1 | 16.3 | 21.1
| | S/N(c) | 7.5 | 15.1 | 19.2
| | SN(E/C) 0.47
|
| 
| 
| 
| 
| 
|
| 3720087
| 47
| | Red | Green | Blue
| | z | | 18.63
| | znorm | | 14.45
| | sky | 14.6 | 14.1 | 14.2
| | S/N | 10.4 | 17.7 | 21.5
| | S/N(c) | 8.6 | 16.0 | 20.4
| | SN(E/C) 0.47
|
| 
| 
| 
| 
| 
|
| 3720088
| 47
| | Red | Green | Blue
| | z | | 18.66
| | znorm | | 14.48
| | sky | 14.5 | 14.1 | 14.3
| | S/N | 11.0 | 18.0 | 21.4
| | S/N(c) | 8.9 | 16.2 | 20.1
| | SN(E/C) 0.43
|
| 
| 
| 
| 
| 
|
| 3720089
| 47
| | Red | Green | Blue
| | z | | 18.77
| | znorm | | 14.59
| | sky | 14.6 | 14.2 | 14.3
| | S/N | 11.6 | 19.2 | 22.7
| | S/N(c) | 9.3 | 17.2 | 20.9
| | SN(E/C) 0.42
|
| 
| 
| 
| 
| 
|
| 3720090
| 47
| | Red | Green | Blue
| | z | | 18.78
| | znorm | | 14.60
| | sky | 14.6 | 14.2 | 14.4
| | S/N | 11.9 | 19.5 | 23.1
| | S/N(c) | 9.7 | 17.6 | 21.1
| | SN(E/C) 0.38
|
| 
| 
| 
| 
| 
|
| 3720091
| 47
| | Red | Green | Blue
| | z | | 18.81
| | znorm | | 14.63
| | sky | 14.6 | 14.2 | 14.2
| | S/N | 11.8 | 19.6 | 22.7
| | S/N(c) | 9.7 | 17.7 | 20.9
| | SN(E/C) 0.39
|
| 
| 
| 
| 
| 
|
| 3720092
| 47
| | Red | Green | Blue
| | z | | 18.71
| | znorm | | 14.53
| | sky | 14.6 | 14.3 | 14.3
| | S/N | 11.1 | 18.5 | 21.4
| | S/N(c) | 9.2 | 16.8 | 19.8
| | SN(E/C) 0.38
|
| 
| 
| 
| 
| 
|
| 3720093
| 47
| | Red | Green | Blue
| | z | | 18.66
| | znorm | | 14.48
| | sky | 14.7 | 14.3 | 14.3
| | S/N | 10.8 | 18.1 | 21.4
| | S/N(c) | 8.8 | 16.3 | 19.8
| | SN(E/C) 0.43
|
| 
| 
| 
| 
| 
|