| Red | Green | Blue | |
| z | 17.64 | ||
| znorm | Inf | ||
| sky | -Inf | -Inf | -Inf |
| S/N | 18.1 | 33.3 | 40.4 |
| S/N(c) | 0.0 | 0.0 | 0.0 |
| SN(E/C) |
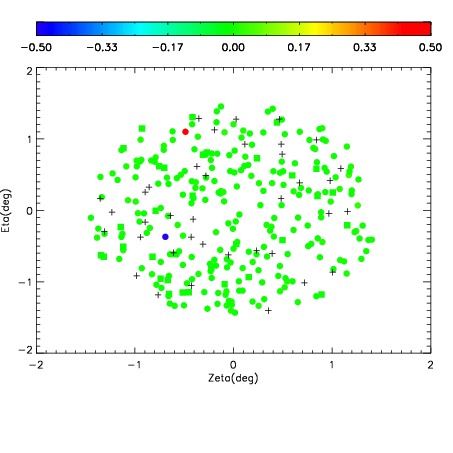
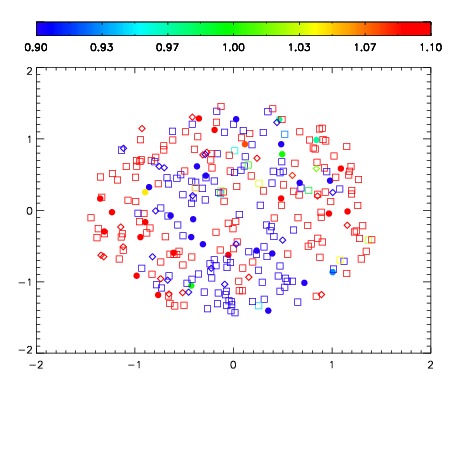
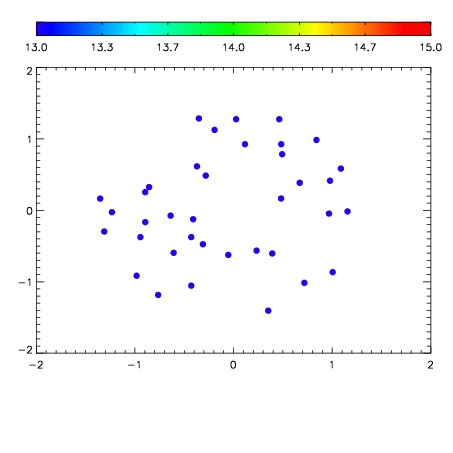

| Frame | Nreads | Zeropoints | Mag plots | Spatial mag deviation | Spatial sky 16325A emission deviations (filled: sky, open: star) | Spatial sky continuum emission | Spatial sky telluric CO2 absorption deviations (filled: H < 10) | |||||||||||||||||||||||
| 0 | 0 |
|
|
|
|
|
|
| IPAIR | NAME | SHIFT | NEWSHIFT | S/N | NAME | SHIFT | NEWSHIFT | S/N |
| 0 | 03720088 | 0.512906 | 0.00000 | 194.140 | 03720090 | -0.00234136 | 0.515247 | 198.205 |
| 1 | 03720091 | 0.510664 | 0.00224203 | 197.578 | 03720089 | -0.000688120 | 0.513594 | 198.416 |
| 2 | 03720087 | 0.506958 | 0.00594801 | 193.285 | 03720086 | 0.00000 | 0.512906 | 190.560 |
| 3 | 03720092 | 0.511449 | 0.00145704 | 186.710 | 03720093 | -0.00157251 | 0.514479 | 178.672 |