| Red | Green | Blue | |
| z | 17.64 | ||
| znorm | Inf | ||
| sky | -Inf | -Inf | -Inf |
| S/N | 19.1 | 36.0 | 38.7 |
| S/N(c) | 0.0 | 0.0 | 0.0 |
| SN(E/C) |
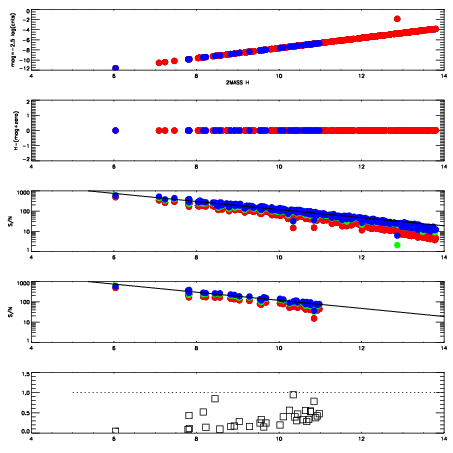
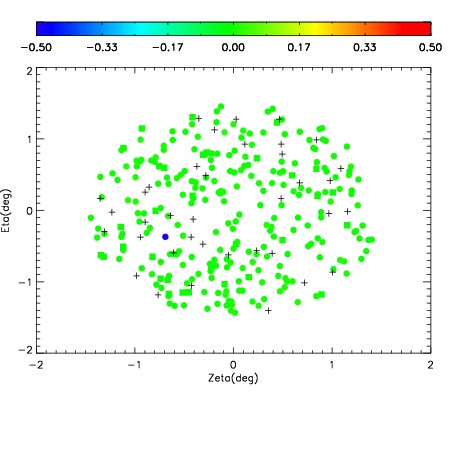
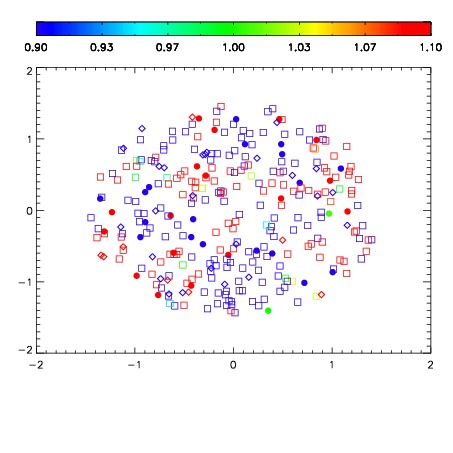
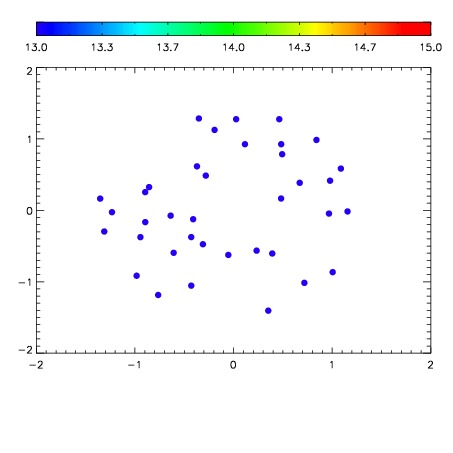

| Frame | Nreads | Zeropoints | Mag plots | Spatial mag deviation | Spatial sky 16325A emission deviations (filled: sky, open: star) | Spatial sky continuum emission | Spatial sky telluric CO2 absorption deviations (filled: H < 10) | |||||||||||||||||||||||
| 0 | 0 |
|
|
|
|
|
|
| IPAIR | NAME | SHIFT | NEWSHIFT | S/N | NAME | SHIFT | NEWSHIFT | S/N |
| 0 | 04570031 | 0.504643 | 0.00000 | 137.395 | 04570029 | -0.00262715 | 0.507270 | 161.857 |
| 1 | 04570027 | 0.501024 | 0.00361902 | 178.133 | 04570028 | -0.00164145 | 0.506284 | 175.057 |
| 2 | 04570026 | 0.501090 | 0.00355303 | 168.110 | 04570025 | 0.00000 | 0.504643 | 172.574 |
| 3 | 04570030 | 0.499870 | 0.00477302 | 137.122 | 04570032 | -2.15673e-05 | 0.504665 | 137.434 |