| Red | Green | Blue | |
| z | 17.64 | ||
| znorm | Inf | ||
| sky | -Inf | -Inf | -Inf |
| S/N | 25.4 | 44.4 | 47.1 |
| S/N(c) | 0.0 | 0.0 | 0.0 |
| SN(E/C) |

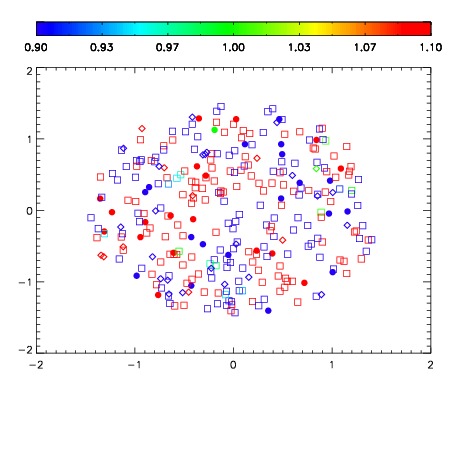
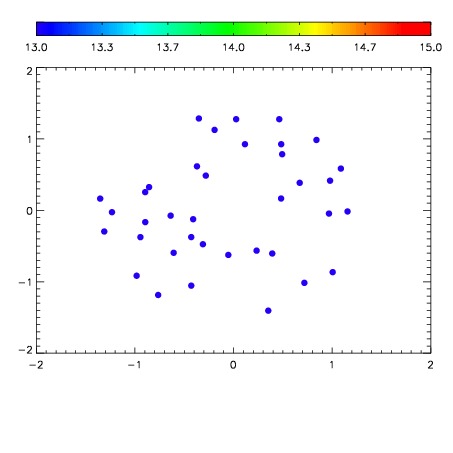

| Frame | Nreads | Zeropoints | Mag plots | Spatial mag deviation | Spatial sky 16325A emission deviations (filled: sky, open: star) | Spatial sky continuum emission | Spatial sky telluric CO2 absorption deviations (filled: H < 10) | |||||||||||||||||||||||
| 0 | 0 |
|
|
|
|
|
|
| IPAIR | NAME | SHIFT | NEWSHIFT | S/N | NAME | SHIFT | NEWSHIFT | S/N |
| 0 | 05180017 | 0.495430 | 0.00000 | 189.317 | 05180014 | 0.000530382 | 0.494900 | 190.480 |
| 1 | 05180016 | 0.495345 | 8.49962e-05 | 188.635 | 05180015 | -0.000276488 | 0.495706 | 189.656 |
| 2 | 05180012 | 0.494356 | 0.00107399 | 186.572 | 05180011 | 0.00000 | 0.495430 | 186.128 |
| 3 | 05180013 | 0.495166 | 0.000263989 | 186.468 | 05180018 | -0.00151156 | 0.496942 | 181.641 |