| Red | Green | Blue | |
| z | 17.64 | ||
| znorm | Inf | ||
| sky | -Inf | -Inf | -Inf |
| S/N | 24.7 | 43.2 | 45.7 |
| S/N(c) | 0.0 | 0.0 | 0.0 |
| SN(E/C) |
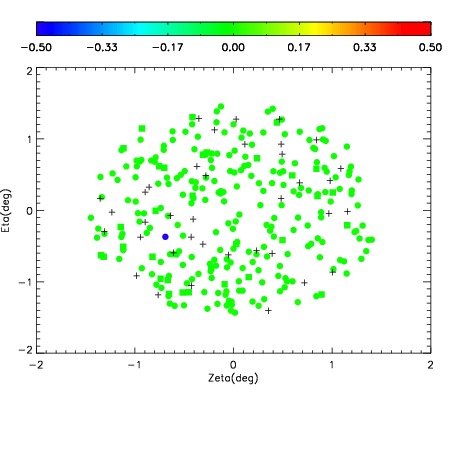
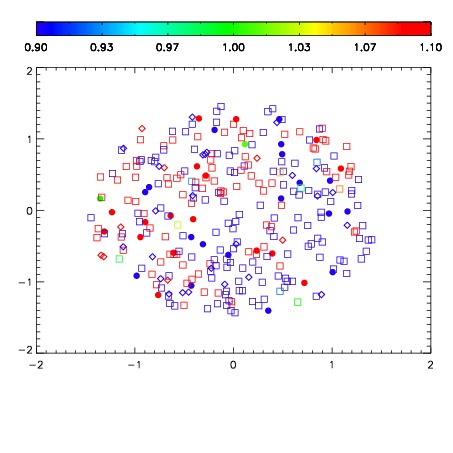
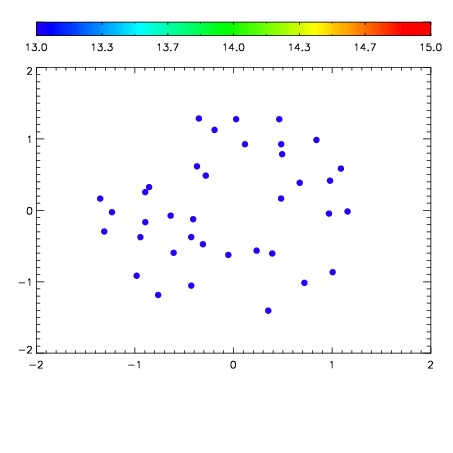

| Frame | Nreads | Zeropoints | Mag plots | Spatial mag deviation | Spatial sky 16325A emission deviations (filled: sky, open: star) | Spatial sky continuum emission | Spatial sky telluric CO2 absorption deviations (filled: H < 10) | |||||||||||||||||||||||
| 0 | 0 |
|
|
|
|
|
|
| IPAIR | NAME | SHIFT | NEWSHIFT | S/N | NAME | SHIFT | NEWSHIFT | S/N |
| 0 | 05190017 | 0.497773 | 0.00000 | 185.174 | 05190014 | -0.000460326 | 0.498233 | 183.050 |
| 1 | 05190016 | 0.497565 | 0.000207990 | 186.832 | 05190018 | -9.66444e-05 | 0.497870 | 187.876 |
| 2 | 05190012 | 0.495483 | 0.00228998 | 185.940 | 05190011 | 0.00000 | 0.497773 | 183.985 |
| 3 | 05190013 | 0.496766 | 0.00100699 | 165.592 | 05190015 | -0.00174120 | 0.499514 | 180.567 |