| Red | Green | Blue | |
| z | 17.64 | ||
| znorm | Inf | ||
| sky | -Inf | -Inf | -Inf |
| S/N | 25.2 | 42.3 | 48.1 |
| S/N(c) | 0.0 | 0.0 | 0.0 |
| SN(E/C) |
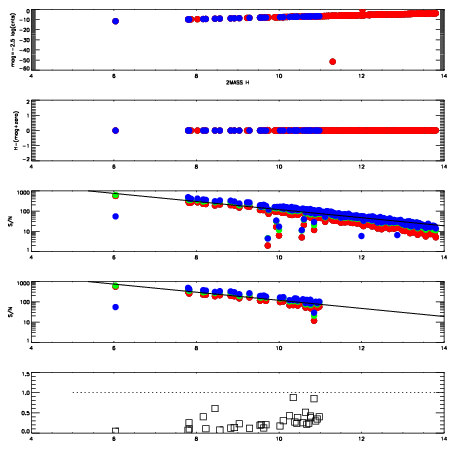
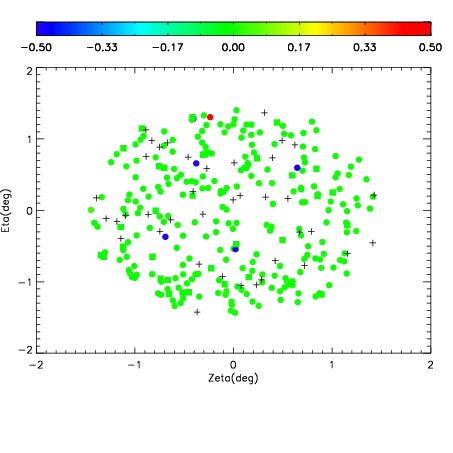
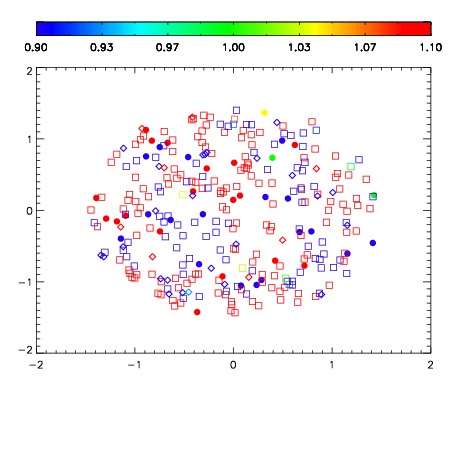
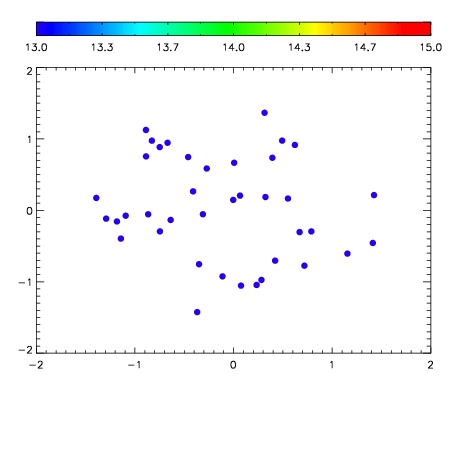

| Frame | Nreads | Zeropoints | Mag plots | Spatial mag deviation | Spatial sky 16325A emission deviations (filled: sky, open: star) | Spatial sky continuum emission | Spatial sky telluric CO2 absorption deviations (filled: H < 10) | |||||||||||||||||||||||
| 0 | 0 |
|
|
|
|
|
|
| IPAIR | NAME | SHIFT | NEWSHIFT | S/N | NAME | SHIFT | NEWSHIFT | S/N |
| 0 | 05200012 | 0.495045 | 0.00000 | 217.748 | 05200013 | 0.00170373 | 0.493341 | 215.953 |
| 1 | 05200016 | 0.492761 | 0.00228402 | 215.574 | 05200014 | 0.00139612 | 0.493649 | 215.530 |
| 2 | 05200015 | 0.492063 | 0.00298202 | 215.206 | 05200017 | 0.00105720 | 0.493988 | 214.860 |
| 3 | 05200011 | 0.492797 | 0.00224802 | 206.215 | 05200010 | 0.00000 | 0.495045 | 204.380 |