| Red | Green | Blue | |
| z | 17.64 | ||
| znorm | Inf | ||
| sky | -Inf | -Inf | -Inf |
| S/N | 21.3 | 40.1 | 40.3 |
| S/N(c) | 0.0 | 0.0 | 0.0 |
| SN(E/C) |

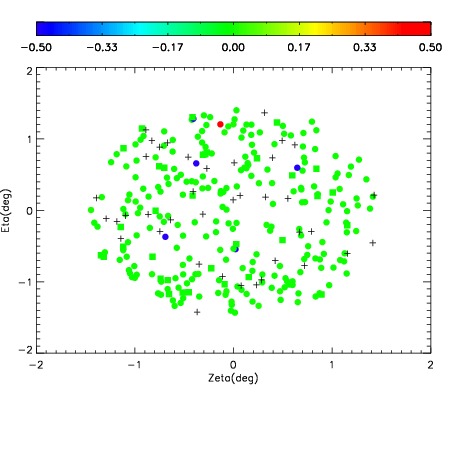
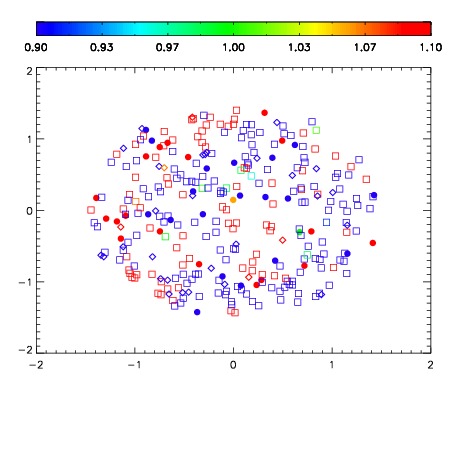
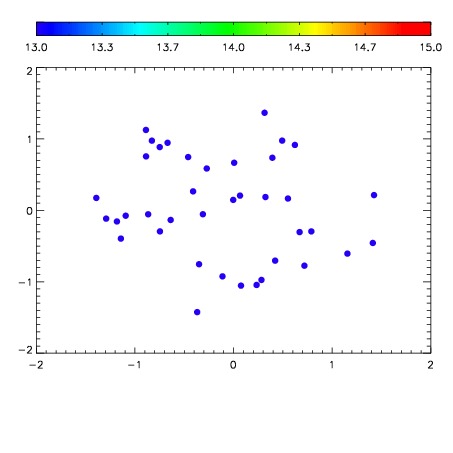

| Frame | Nreads | Zeropoints | Mag plots | Spatial mag deviation | Spatial sky 16325A emission deviations (filled: sky, open: star) | Spatial sky continuum emission | Spatial sky telluric CO2 absorption deviations (filled: H < 10) | |||||||||||||||||||||||
| 0 | 0 |
|
|
|
|
|
|
| IPAIR | NAME | SHIFT | NEWSHIFT | S/N | NAME | SHIFT | NEWSHIFT | S/N |
| 0 | 07550013 | 0.475826 | 0.00000 | 157.002 | 07550015 | -0.000524160 | 0.476350 | 156.819 |
| 1 | 07550016 | 0.471623 | 0.00420299 | 164.479 | 07550018 | -0.0121515 | 0.487978 | 170.160 |
| 2 | 07550017 | 0.473168 | 0.00265801 | 163.757 | 07550014 | -8.71113e-06 | 0.475835 | 162.436 |
| 3 | 07550012 | 0.475809 | 1.69873e-05 | 150.226 | 07550011 | 0.00000 | 0.475826 | 131.911 |