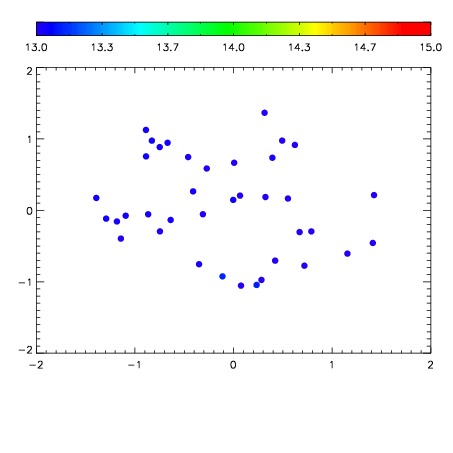
| Frame | Nreads | Zeropoints | Mag plots
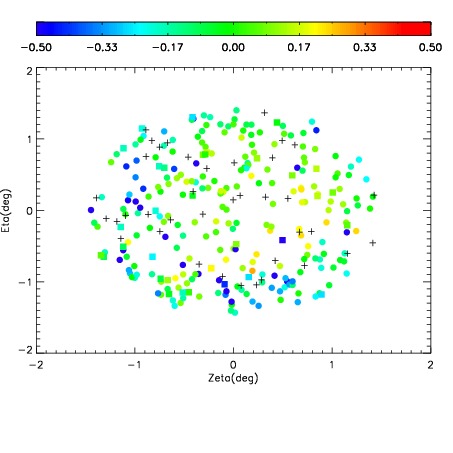
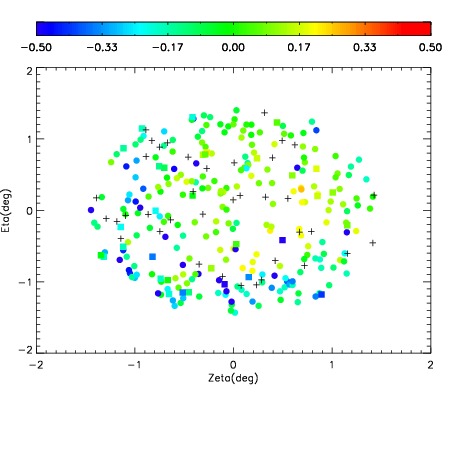
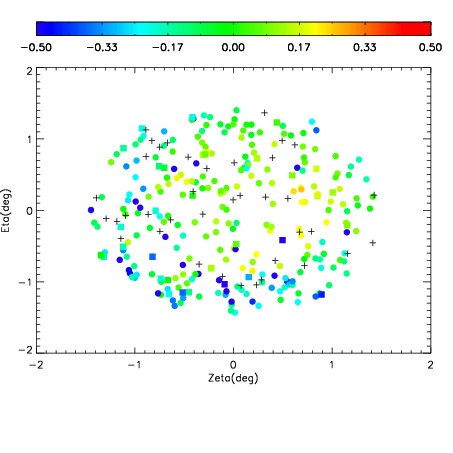
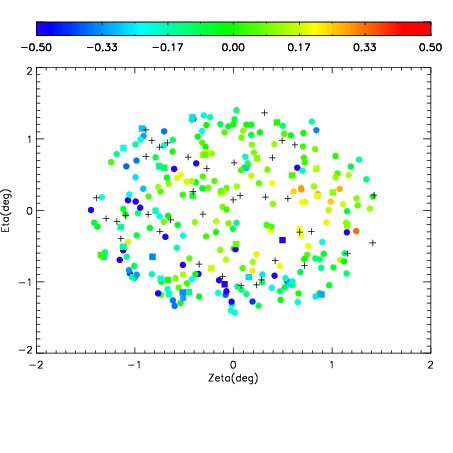
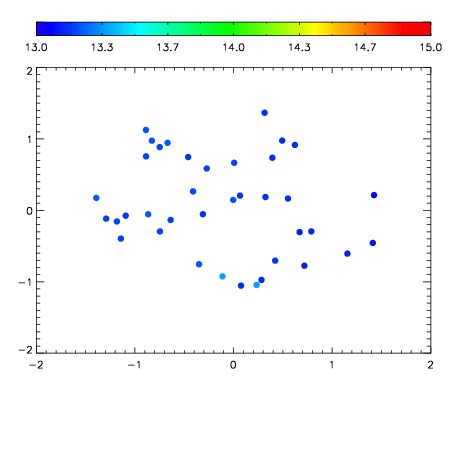
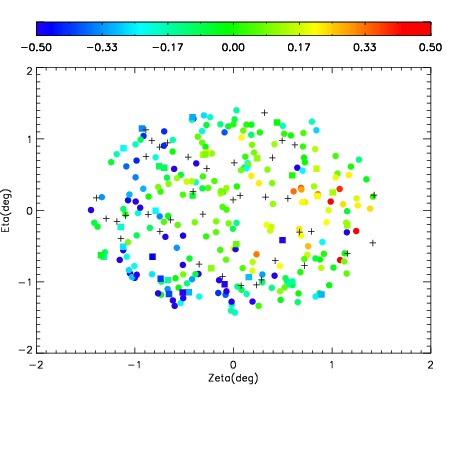
| Spatial mag deviation
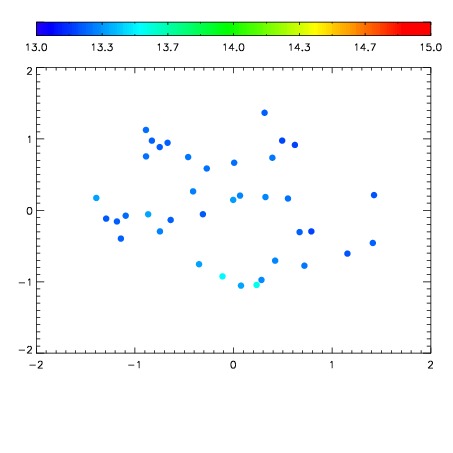
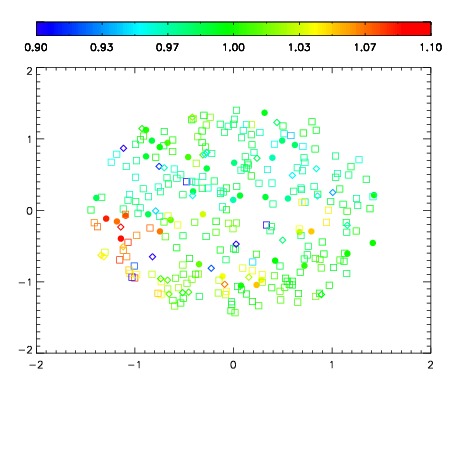
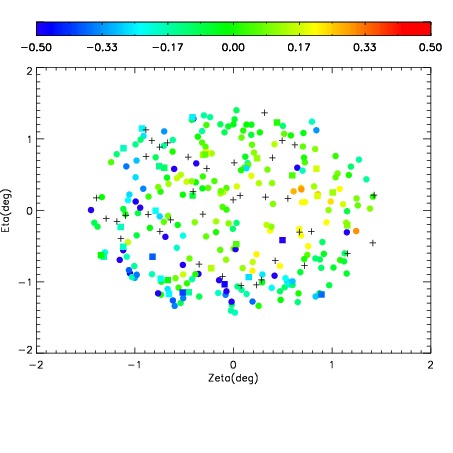
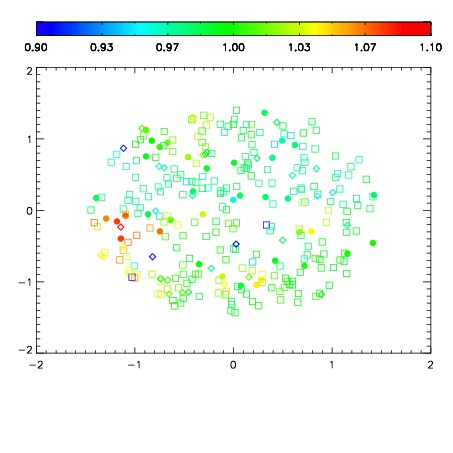
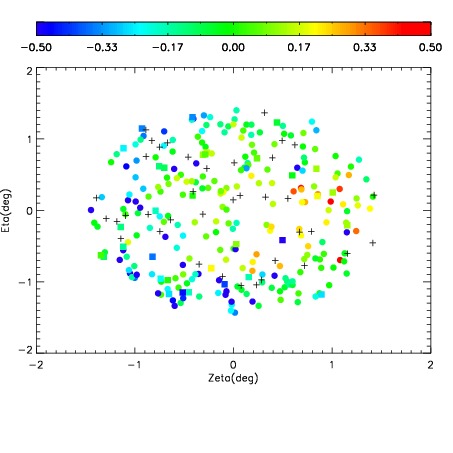
| Spatial sky 16325A emission deviations (filled: sky, open: star)
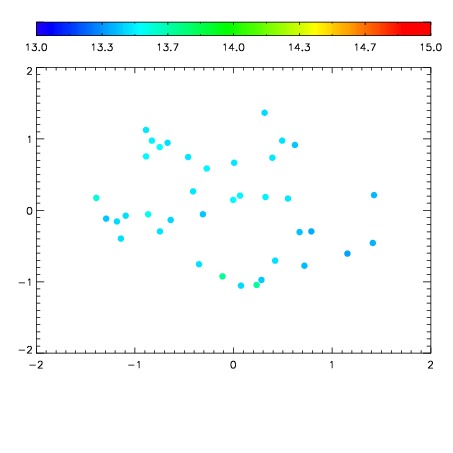
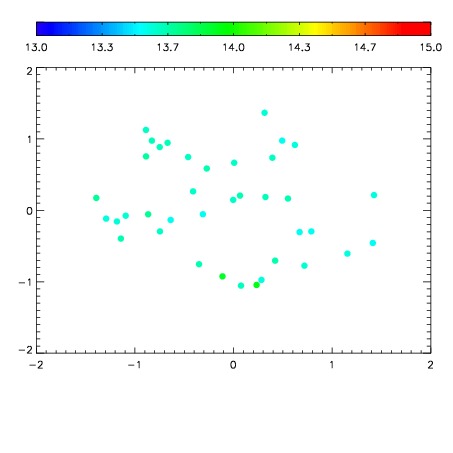
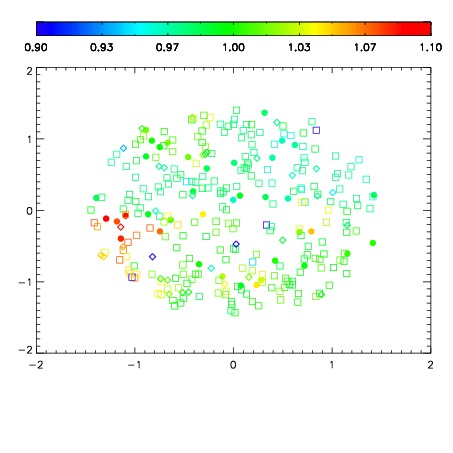
| Spatial sky continuum emission
| Spatial sky telluric CO2 absorption deviations (filled: H < 10)
|
| 7630043
| 47
| | Red | Green | Blue
| | z | | 18.02
| | znorm | | 13.84
| | sky | 13.5 | 13.3 | 13.2
| | S/N | 6.6 | 11.3 | 13.7
| | S/N(c) | 5.9 | 10.6 | 13.5
| | SN(E/C) 0.54
|
| 
| 
| 
| 
| 
|
| 7630044
| 47
| | Red | Green | Blue
| | z | | 18.19
| | znorm | | 14.01
| | sky | 13.7 | 13.5 | 13.6
| | S/N | 7.3 | 13.3 | 16.7
| | S/N(c) | 6.6 | 12.6 | 15.8
| | SN(E/C) 0.56
|
| 
| 
| 
| 
| 
|
| 7630045
| 47
| | Red | Green | Blue
| | z | | 18.30
| | znorm | | 14.12
| | sky | 13.7 | 13.6 | 13.7
| | S/N | 8.3 | 14.8 | 17.3
| | S/N(c) | 7.5 | 13.9 | 16.7
| | SN(E/C) 0.52
|
| 
| 
| 
| 
| 
|
| 7630046
| 47
| | Red | Green | Blue
| | z | | 17.91
| | znorm | | 13.73
| | sky | 13.5 | 13.4 | 13.4
| | S/N | 5.7 | 10.5 | 12.8
| | S/N(c) | 5.1 | 9.8 | 12.1
| | SN(E/C) 0.60
|
| 
| 
| 
| 
| 
|
| 7630047
| 47
| | Red | Green | Blue
| | z | | 17.70
| | znorm | | 13.52
| | sky | 13.3 | 13.2 | 13.2
| | S/N | 4.6 | 8.9 | 10.7
| | S/N(c) | 4.1 | 8.3 | 10.1
| | SN(E/C) 0.64
|
| 
| 
| 
| 
| 
|
| 7630048
| 47
| | Red | Green | Blue
| | z | | 17.50
| | znorm | | 13.32
| | sky | 13.2 | 13.2 | 13.2
| | S/N | 3.8 | 7.6 | 9.0
| | S/N(c) | 3.6 | 7.2 | 8.4
| | SN(E/C) 0.69
|
| 
| 
| 
| 
| 
|
| 7630049
| 47
| | Red | Green | Blue
| | z | | 17.44
| | znorm | | 13.26
| | sky | 13.2 | 13.1 | 13.1
| | S/N | 3.8 | 7.0 | 8.2
| | S/N(c) | 3.4 | 6.6 | 8.1
| | SN(E/C) 0.71
|
| 
| 
| 
| 
| 
|
| 7630050
| 47
| | Red | Green | Blue
| | z | | 17.18
| | znorm | | 13.00
| | sky | 13.1 | 13.0 | 13.1
| | S/N | 2.8 | 5.4 | 6.4
| | S/N(c) | 2.4 | 5.0 | 6.4
| | SN(E/C) 0.74
|
| 
| 
| 
| 
| 
|