| Red | Green | Blue | |
| z | 17.64 | ||
| znorm | Inf | ||
| sky | -Inf | -Inf | -Inf |
| S/N | 23.1 | 39.9 | 46.8 |
| S/N(c) | 0.0 | 0.0 | 0.0 |
| SN(E/C) |
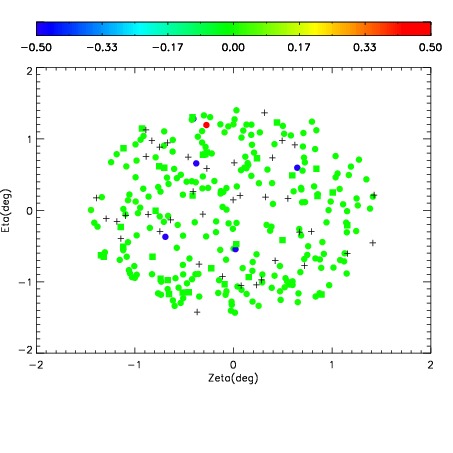
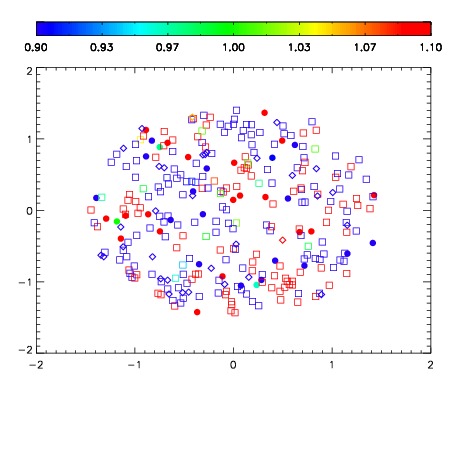
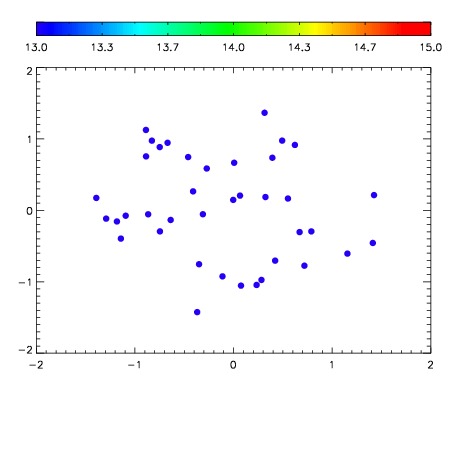

| Frame | Nreads | Zeropoints | Mag plots | Spatial mag deviation | Spatial sky 16325A emission deviations (filled: sky, open: star) | Spatial sky continuum emission | Spatial sky telluric CO2 absorption deviations (filled: H < 10) | |||||||||||||||||||||||
| 0 | 0 |
|
|
|
|
|
|
| IPAIR | NAME | SHIFT | NEWSHIFT | S/N | NAME | SHIFT | NEWSHIFT | S/N |
| 0 | 07920046 | 0.492452 | 0.00000 | 197.504 | 07920051 | -0.00185698 | 0.494309 | 203.698 |
| 1 | 07920049 | 0.491243 | 0.00120899 | 195.785 | 07920047 | -0.00172488 | 0.494177 | 200.265 |
| 2 | 07920045 | 0.492430 | 2.19941e-05 | 190.647 | 07920048 | -0.00366160 | 0.496114 | 191.700 |
| 3 | 07920050 | 0.492298 | 0.000153989 | 178.901 | 07920044 | 0.00000 | 0.492452 | 191.606 |