| Red | Green | Blue | |
| z | 17.64 | ||
| znorm | Inf | ||
| sky | -Inf | -Inf | -Inf |
| S/N | 21.1 | 39.4 | 44.9 |
| S/N(c) | 0.0 | 0.0 | 0.0 |
| SN(E/C) |
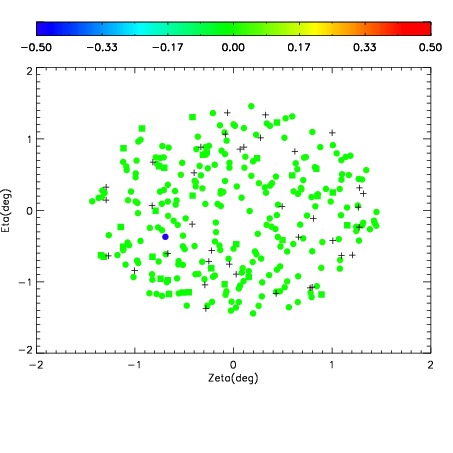
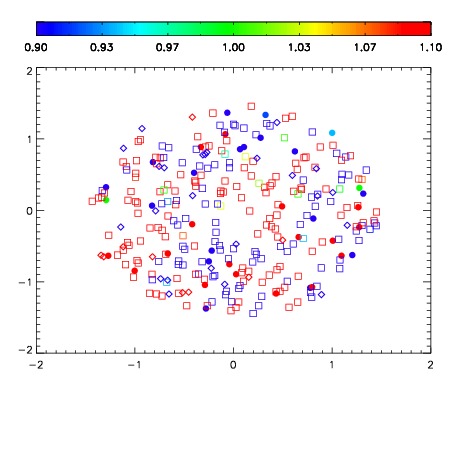
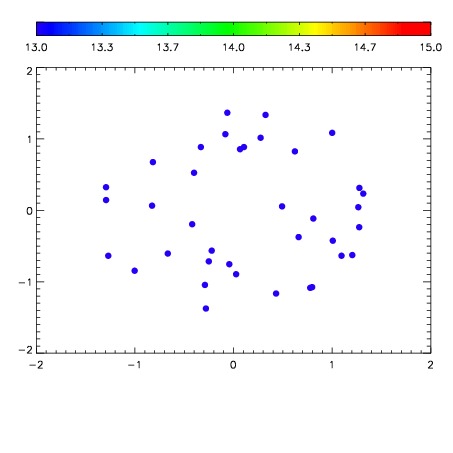

| Frame | Nreads | Zeropoints | Mag plots | Spatial mag deviation | Spatial sky 16325A emission deviations (filled: sky, open: star) | Spatial sky continuum emission | Spatial sky telluric CO2 absorption deviations (filled: H < 10) | |||||||||||||||||||||||
| 0 | 0 |
|
|
|
|
|
|
| IPAIR | NAME | SHIFT | NEWSHIFT | S/N | NAME | SHIFT | NEWSHIFT | S/N |
| 0 | 08140050 | 0.511135 | 0.00000 | 177.288 | 08140048 | 0.00000 | 0.511135 | 179.943 |
| 1 | 08140054 | 0.509633 | 0.00150198 | 185.897 | 08140051 | -0.000951962 | 0.512087 | 184.290 |
| 2 | 08140049 | 0.509854 | 0.00128096 | 183.355 | 08140055 | -0.000321730 | 0.511457 | 182.893 |
| 3 | 08140053 | 0.508711 | 0.00242400 | 182.022 | 08140052 | -0.000418822 | 0.511554 | 181.758 |