| Red | Green | Blue | |
| z | 17.64 | ||
| znorm | Inf | ||
| sky | -Inf | -Inf | -Inf |
| S/N | 20.2 | 33.1 | 36.4 |
| S/N(c) | 0.0 | 0.0 | 0.0 |
| SN(E/C) |
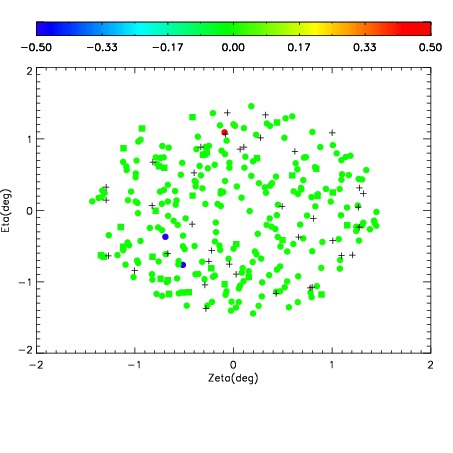
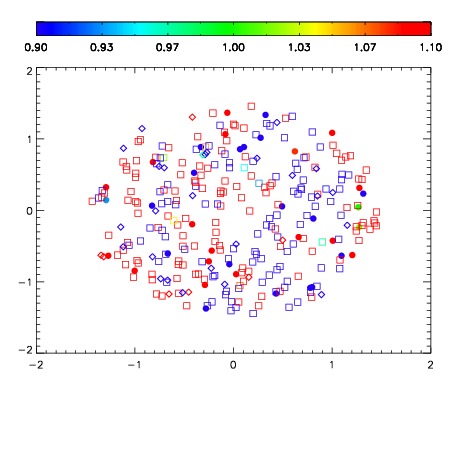
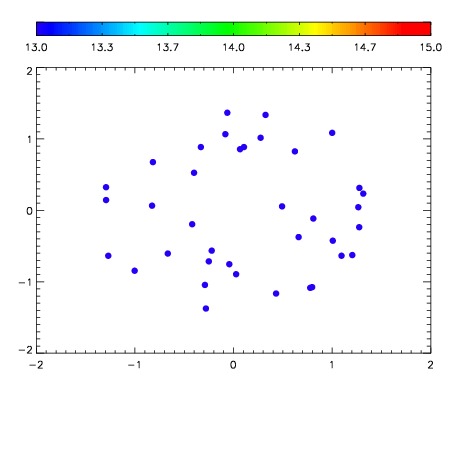

| Frame | Nreads | Zeropoints | Mag plots | Spatial mag deviation | Spatial sky 16325A emission deviations (filled: sky, open: star) | Spatial sky continuum emission | Spatial sky telluric CO2 absorption deviations (filled: H < 10) | |||||||||||||||||||||||
| 0 | 0 |
|
|
|
|
|
|
| IPAIR | NAME | SHIFT | NEWSHIFT | S/N | NAME | SHIFT | NEWSHIFT | S/N |
| 0 | 08180014 | 0.514199 | 0.00000 | 197.448 | 08180019 | 0.00136613 | 0.512833 | 183.819 |
| 1 | 08180013 | 0.512092 | 0.00210702 | 198.585 | 08180012 | 0.00000 | 0.514199 | 200.394 |
| 2 | 08180018 | 0.512564 | 0.00163502 | 167.623 | 08180015 | -0.000740662 | 0.514940 | 178.127 |
| 3 | 08180017 | 0.508074 | 0.00612503 | 132.776 | 08180016 | -0.00134643 | 0.515545 | 176.099 |