| Red | Green | Blue | |
| z | 17.64 | ||
| znorm | Inf | ||
| sky | -Inf | -Inf | -Inf |
| S/N | 24.3 | 43.4 | 48.9 |
| S/N(c) | 0.0 | 0.0 | 0.0 |
| SN(E/C) |
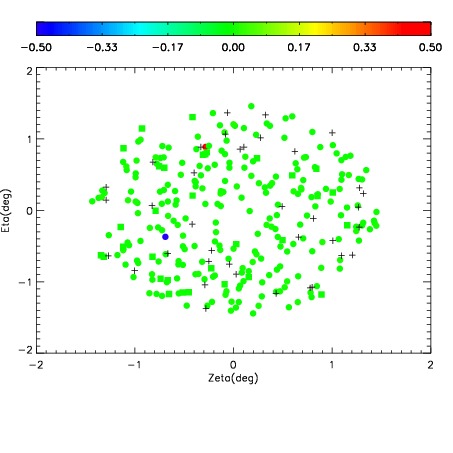
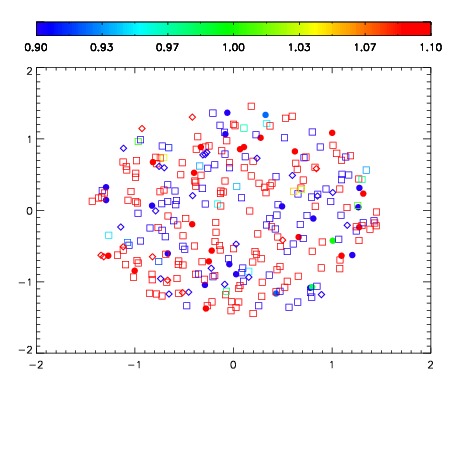


| Frame | Nreads | Zeropoints | Mag plots | Spatial mag deviation | Spatial sky 16325A emission deviations (filled: sky, open: star) | Spatial sky continuum emission | Spatial sky telluric CO2 absorption deviations (filled: H < 10) | |||||||||||||||||||||||
| 0 | 0 |
|
|
|
|
|
|
| IPAIR | NAME | SHIFT | NEWSHIFT | S/N | NAME | SHIFT | NEWSHIFT | S/N |
| 0 | 08410043 | 0.507147 | 0.00000 | 200.005 | 08410044 | 0.00338340 | 0.503764 | 198.202 |
| 1 | 08410042 | 0.506300 | 0.000847042 | 199.419 | 08410040 | -0.000177838 | 0.507325 | 197.603 |
| 2 | 08410039 | 0.505514 | 0.00163299 | 196.413 | 08410041 | -0.000934324 | 0.508081 | 197.026 |
| 3 | 08410038 | 0.505168 | 0.00197899 | 191.808 | 08410037 | 0.00000 | 0.507147 | 193.049 |