| Red | Green | Blue | |
| z | 17.64 | ||
| znorm | Inf | ||
| sky | -Inf | -Inf | -Inf |
| S/N | 20.8 | 38.4 | 45.9 |
| S/N(c) | 0.0 | 0.0 | 0.0 |
| SN(E/C) |
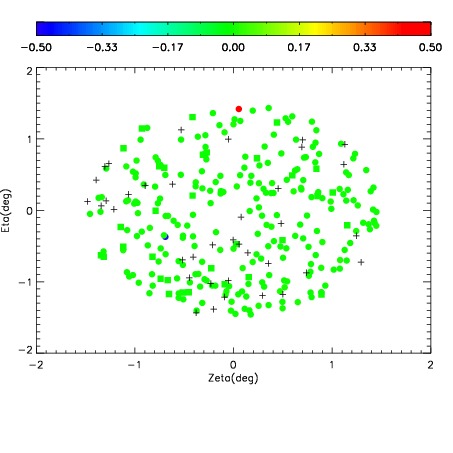
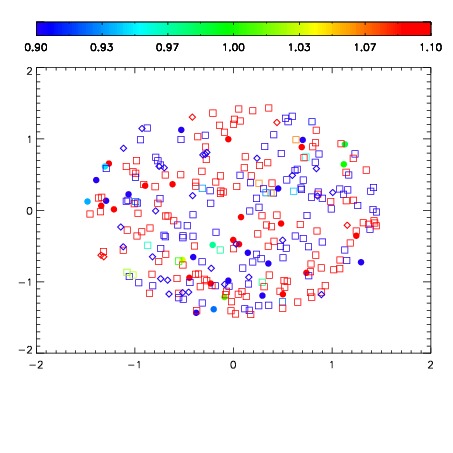
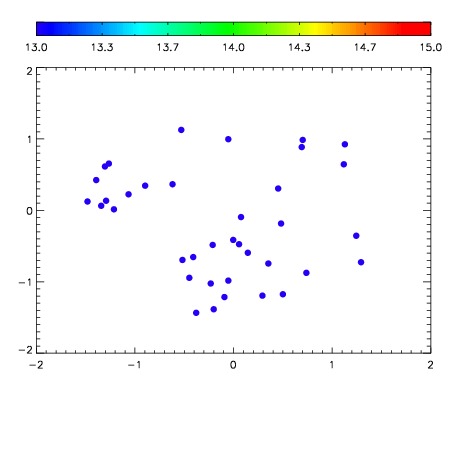

| Frame | Nreads | Zeropoints | Mag plots | Spatial mag deviation | Spatial sky 16325A emission deviations (filled: sky, open: star) | Spatial sky continuum emission | Spatial sky telluric CO2 absorption deviations (filled: H < 10) | |||||||||||||||||||||||
| 0 | 0 |
|
|
|
|
|
|
| IPAIR | NAME | SHIFT | NEWSHIFT | S/N | NAME | SHIFT | NEWSHIFT | S/N |
| 0 | 08150043 | 0.517096 | 0.00000 | 171.794 | 08150041 | 0.00206629 | 0.515030 | 172.260 |
| 1 | 08150038 | 0.504594 | 0.0125020 | 179.521 | 08150044 | 0.00105367 | 0.516042 | 177.952 |
| 2 | 08150039 | 0.513052 | 0.00404400 | 172.428 | 08150040 | 0.00142374 | 0.515672 | 174.553 |
| 3 | 08150042 | 0.505966 | 0.0111300 | 168.177 | 08150037 | 0.00000 | 0.517096 | 171.839 |