| Red | Green | Blue | |
| z | 17.64 | ||
| znorm | Inf | ||
| sky | -Inf | -Inf | -Inf |
| S/N | 18.4 | 34.5 | 37.0 |
| S/N(c) | 0.0 | 0.0 | 0.0 |
| SN(E/C) |
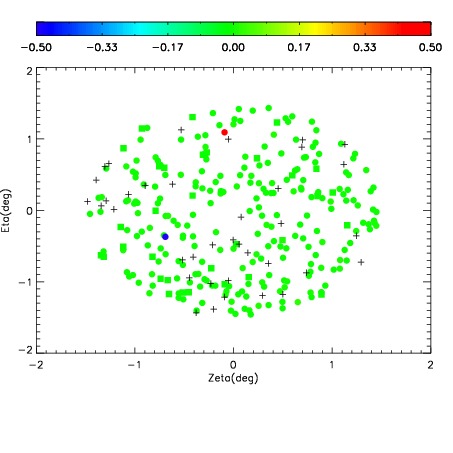
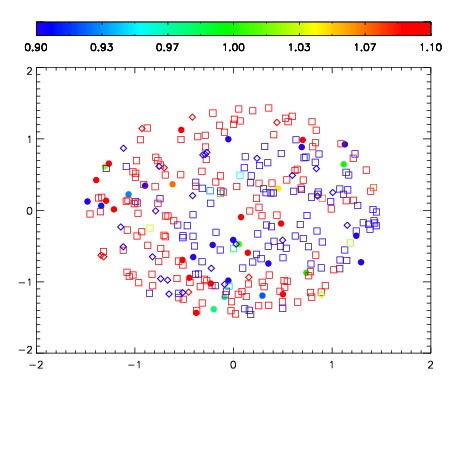
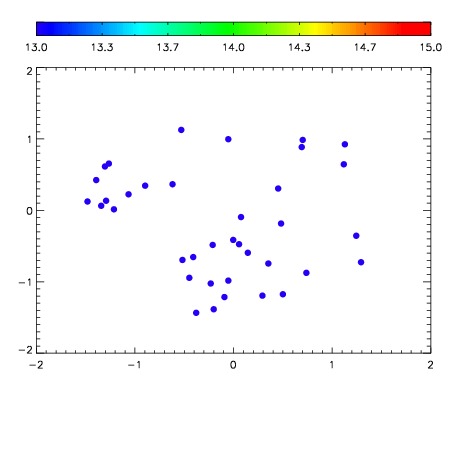

| Frame | Nreads | Zeropoints | Mag plots | Spatial mag deviation | Spatial sky 16325A emission deviations (filled: sky, open: star) | Spatial sky continuum emission | Spatial sky telluric CO2 absorption deviations (filled: H < 10) | |||||||||||||||||||||||
| 0 | 0 |
|
|
|
|
|
|
| IPAIR | NAME | SHIFT | NEWSHIFT | S/N | NAME | SHIFT | NEWSHIFT | S/N |
| 0 | 08210013 | 0.514114 | 0.00000 | 139.896 | 08210014 | 0.00131272 | 0.512801 | 155.627 |
| 1 | 08210016 | 0.505886 | 0.00822800 | 189.328 | 08210018 | 0.000897199 | 0.513217 | 196.520 |
| 2 | 08210017 | 0.511219 | 0.00289500 | 188.560 | 08210011 | 0.00000 | 0.514114 | 177.288 |
| 3 | 08210012 | 0.506123 | 0.00799102 | 169.187 | 08210015 | 0.000804645 | 0.513309 | 169.431 |