| Red | Green | Blue | |
| z | 17.64 | ||
| znorm | Inf | ||
| sky | -Inf | -Inf | -Inf |
| S/N | 21.5 | 39.3 | 47.1 |
| S/N(c) | 0.0 | 0.0 | 0.0 |
| SN(E/C) |
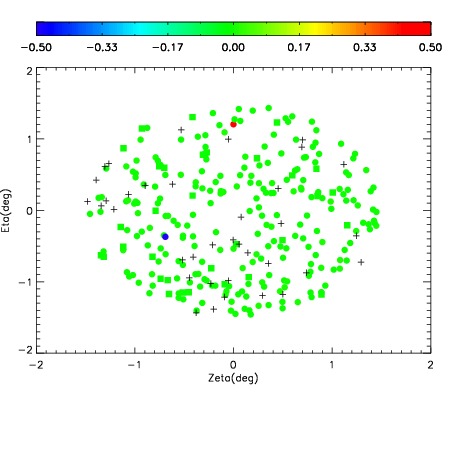
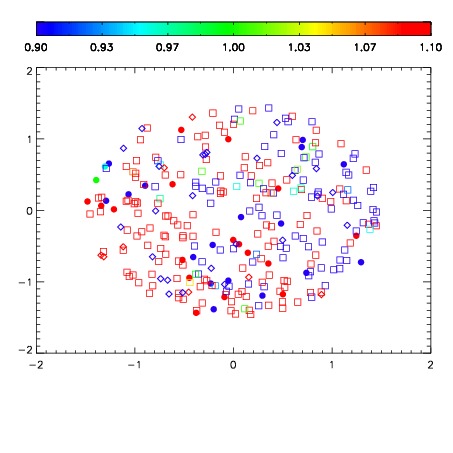
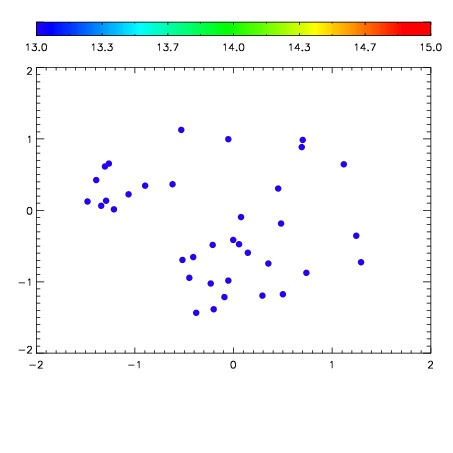

| Frame | Nreads | Zeropoints | Mag plots | Spatial mag deviation | Spatial sky 16325A emission deviations (filled: sky, open: star) | Spatial sky continuum emission | Spatial sky telluric CO2 absorption deviations (filled: H < 10) | |||||||||||||||||||||||
| 0 | 0 |
|
|
|
|
|
|
| IPAIR | NAME | SHIFT | NEWSHIFT | S/N | NAME | SHIFT | NEWSHIFT | S/N |
| 0 | 08420038 | 0.493330 | 0.00000 | 207.815 | 08420037 | 0.00000 | 0.493330 | 209.708 |
| 1 | 08420042 | 0.489041 | 0.00428900 | 213.700 | 08420044 | 0.00641826 | 0.486912 | 216.015 |
| 2 | 08420043 | 0.489500 | 0.00383002 | 213.459 | 08420040 | 0.00493363 | 0.488396 | 213.425 |
| 3 | 08420039 | 0.493220 | 0.000110000 | 212.988 | 08420041 | 0.00378770 | 0.489542 | 213.387 |