| Red | Green | Blue | |
| z | 17.64 | ||
| znorm | Inf | ||
| sky | -Inf | -Inf | -Inf |
| S/N | 18.5 | 34.6 | 38.3 |
| S/N(c) | 0.0 | 0.0 | 0.0 |
| SN(E/C) |
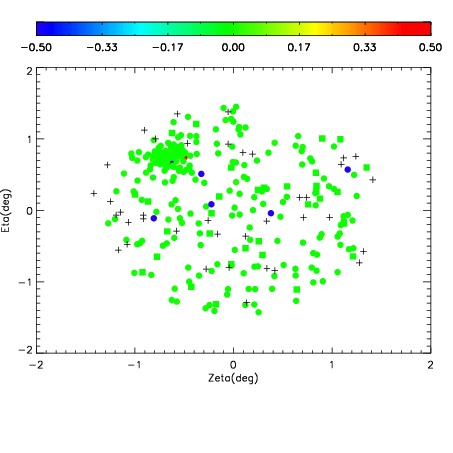
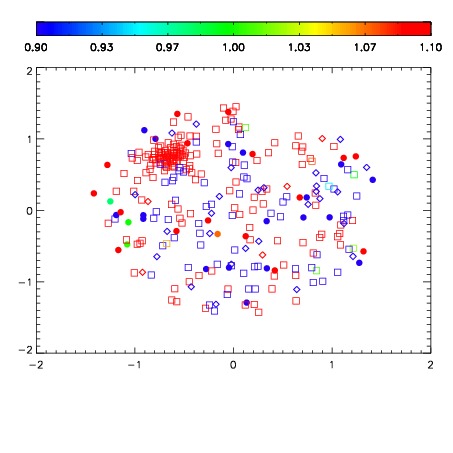


| Frame | Nreads | Zeropoints | Mag plots | Spatial mag deviation | Spatial sky 16325A emission deviations (filled: sky, open: star) | Spatial sky continuum emission | Spatial sky telluric CO2 absorption deviations (filled: H < 10) | |||||||||||||||||||||||
| 0 | 0 |
|
|
|
|
|
|
| IPAIR | NAME | SHIFT | NEWSHIFT | S/N | NAME | SHIFT | NEWSHIFT | S/N |
| 0 | 03740062 | 0.506441 | 0.00000 | 210.228 | 03740063 | 0.00412936 | 0.502312 | 206.390 |
| 1 | 03740061 | 0.501818 | 0.00462300 | 204.490 | 03740059 | 0.00133169 | 0.505109 | 204.386 |
| 2 | 03740058 | 0.501713 | 0.00472802 | 203.353 | 03740060 | 0.00163129 | 0.504810 | 197.032 |
| 3 | 03740057 | 0.498266 | 0.00817499 | 190.641 | 03740056 | 0.00000 | 0.506441 | 185.720 |