| Red | Green | Blue | |
| z | 17.64 | ||
| znorm | Inf | ||
| sky | -Inf | -Inf | -Inf |
| S/N | 17.8 | 32.6 | 34.7 |
| S/N(c) | 0.0 | 0.0 | 0.0 |
| SN(E/C) |
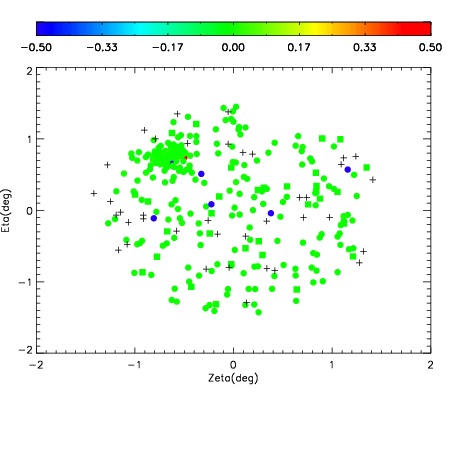
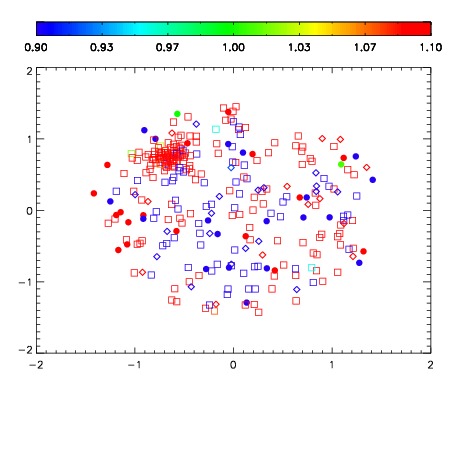
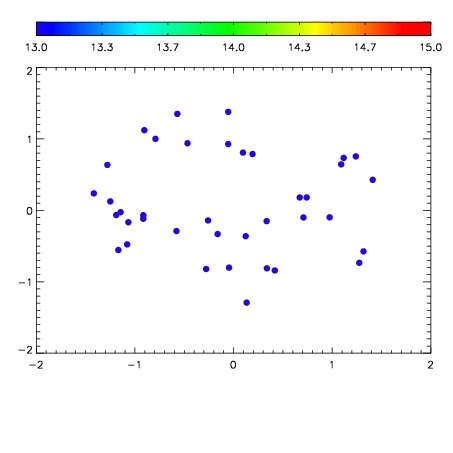

| Frame | Nreads | Zeropoints | Mag plots | Spatial mag deviation | Spatial sky 16325A emission deviations (filled: sky, open: star) | Spatial sky continuum emission | Spatial sky telluric CO2 absorption deviations (filled: H < 10) | |||||||||||||||||||||||
| 0 | 0 |
|
|
|
|
|
|
| IPAIR | NAME | SHIFT | NEWSHIFT | S/N | NAME | SHIFT | NEWSHIFT | S/N |
| 0 | 03750098 | 0.503970 | 0.00000 | 205.758 | 03750095 | 0.000645072 | 0.503325 | 205.356 |
| 1 | 03750094 | 0.503276 | 0.000694036 | 216.585 | 03750099 | 0.00249690 | 0.501473 | 207.965 |
| 2 | 03750097 | 0.503132 | 0.000838041 | 201.049 | 03750092 | 0.00000 | 0.503970 | 203.664 |
| 3 | 03750093 | 0.502103 | 0.00186706 | 200.759 | 03750096 | -0.000166102 | 0.504136 | 199.647 |