| Frame | Nreads | Zeropoints | Mag plots
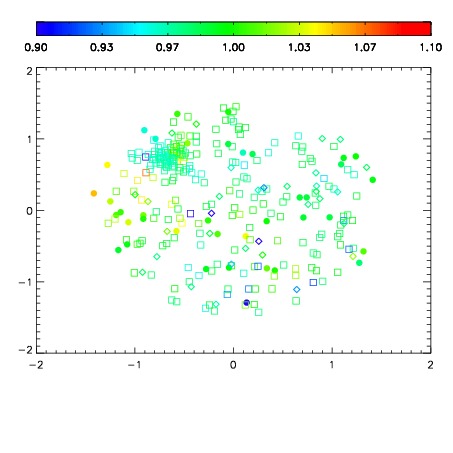
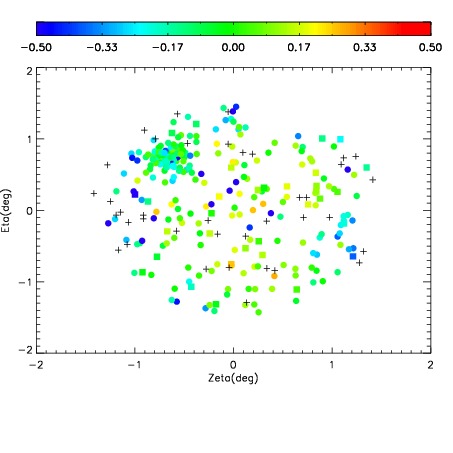
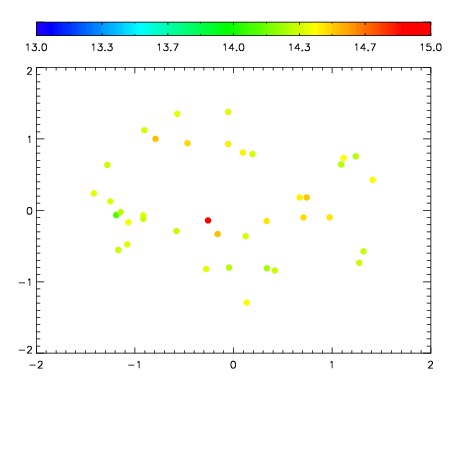
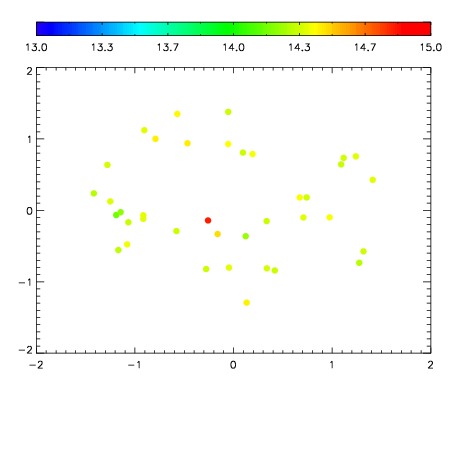
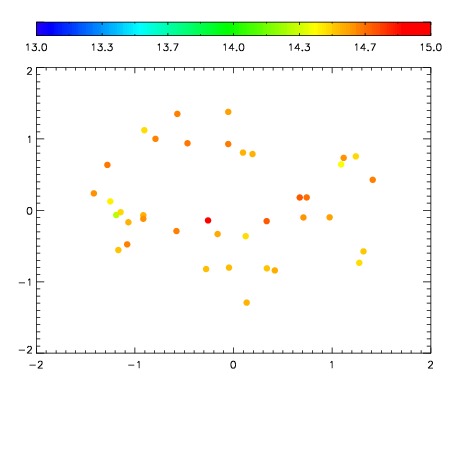
| Spatial mag deviation
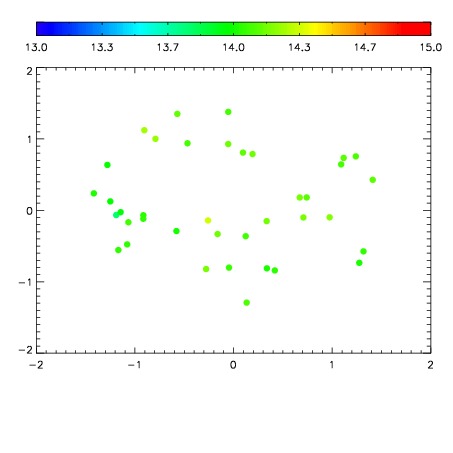
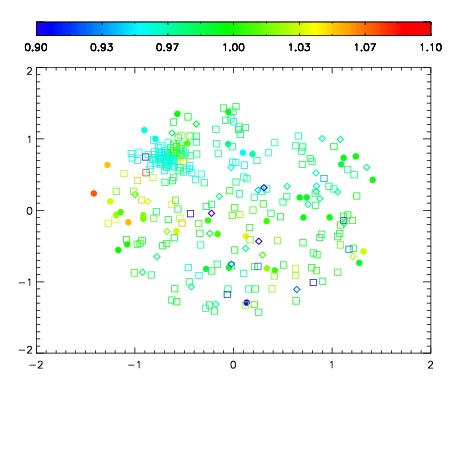
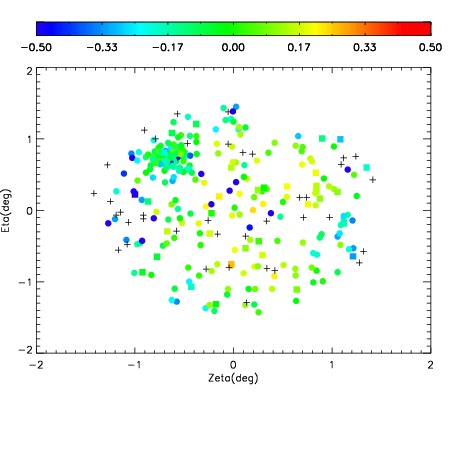
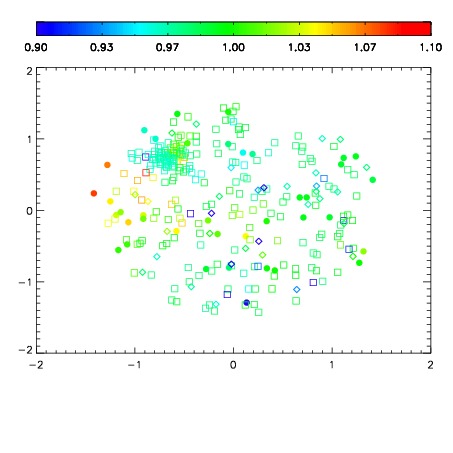
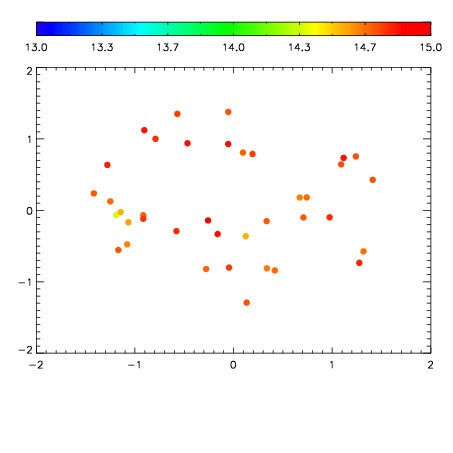
| Spatial sky 16325A emission deviations (filled: sky, open: star)
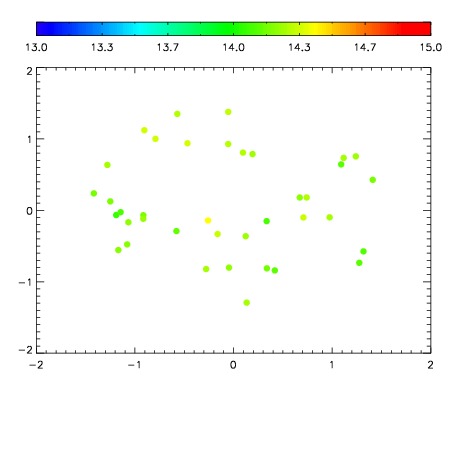
| Spatial sky continuum emission
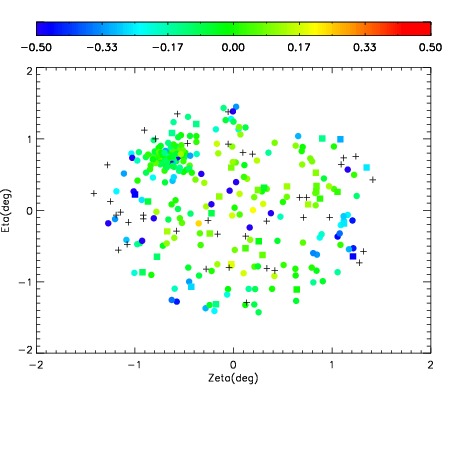
| Spatial sky telluric CO2 absorption deviations (filled: H < 10)
|
| 3760088
| 47
| | Red | Green | Blue
| | z | | 17.94
| | znorm | | 13.76
| | sky | 14.4 | 14.1 | 13.9
| | S/N | 6.1 | 11.4 | 13.6
| | S/N(c) | 5.2 | 10.6 | 12.6
| | SN(E/C) 0.58
|
| 
| 
| 
| 
| 
|
| 3760089
| 47
| | Red | Green | Blue
| | z | | 18.43
| | znorm | | 14.25
| | sky | 14.6 | 14.2 | 14.4
| | S/N | 8.1 | 14.8 | 15.2
| | S/N(c) | 7.0 | 13.8 | 14.3
| | SN(E/C) 0.51
|
| 
| 
| 
| 
| 
|
| 3760090
| 47
| | Red | Green | Blue
| | z | | 18.48
| | znorm | | 14.30
| | sky | 14.8 | 14.4 | 14.5
| | S/N | 8.5 | 15.1 | 15.5
| | S/N(c) | 7.3 | 14.2 | 14.5
| | SN(E/C) 0.52
|
| 
| 
| 
| 
| 
|
| 3760091
| 47
| | Red | Green | Blue
| | z | | 18.54
| | znorm | | 14.36
| | sky | 14.7 | 14.3 | 14.5
| | S/N | 9.4 | 16.3 | 17.0
| | S/N(c) | 8.0 | 15.1 | 16.0
| | SN(E/C) 0.48
|
| 
| 
| 
| 
| 
|
| 3760092
| 47
| | Red | Green | Blue
| | z | | 18.74
| | znorm | | 14.56
| | sky | 14.5 | 14.4 | 14.4
| | S/N | 9.2 | 16.5 | 16.9
| | S/N(c) | 8.1 | 15.1 | 15.9
| | SN(E/C) 0.45
|
| 
| 
| 
| 
| 
|
| 3760093
| 47
| | Red | Green | Blue
| | z | | 18.74
| | znorm | | 14.56
| | sky | 14.6 | 14.5 | 14.5
| | S/N | 9.7 | 17.2 | 17.6
| | S/N(c) | 8.4 | 15.8 | 16.7
| | SN(E/C) 0.38
|
| 
| 
| 
| 
| 
|
| 3760094
| 47
| | Red | Green | Blue
| | z | | 18.88
| | znorm | | 14.70
| | sky | 14.8 | 14.6 | 14.6
| | S/N | 10.8 | 18.9 | 19.7
| | S/N(c) | 9.6 | 17.6 | 18.7
| | SN(E/C) 0.41
|
| 
| 
| 
| 
| 
|
| 3760095
| 47
| | Red | Green | Blue
| | z | | 18.94
| | znorm | | 14.76
| | sky | 15.1 | 14.7 | 14.7
| | S/N | 11.1 | 19.0 | 19.6
| | S/N(c) | 9.6 | 17.6 | 18.6
| | SN(E/C) 0.41
|
| 
| 
| 
| 
| 
|