| Red | Green | Blue | |
| z | 17.64 | ||
| znorm | Inf | ||
| sky | -Inf | -Inf | -Inf |
| S/N | 16.0 | 30.4 | 31.6 |
| S/N(c) | 0.0 | 0.0 | 0.0 |
| SN(E/C) |
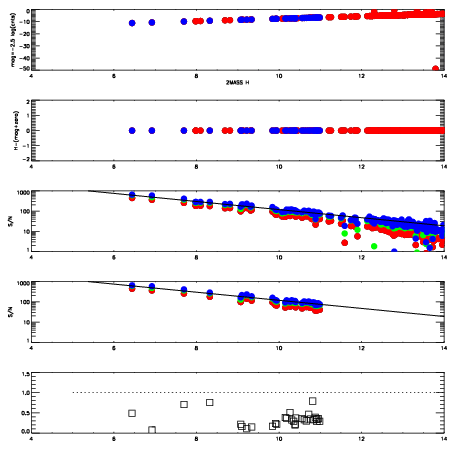
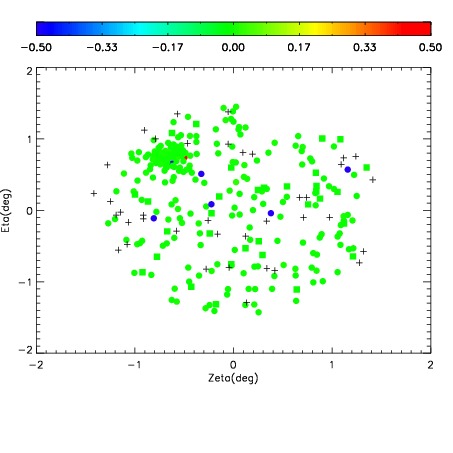
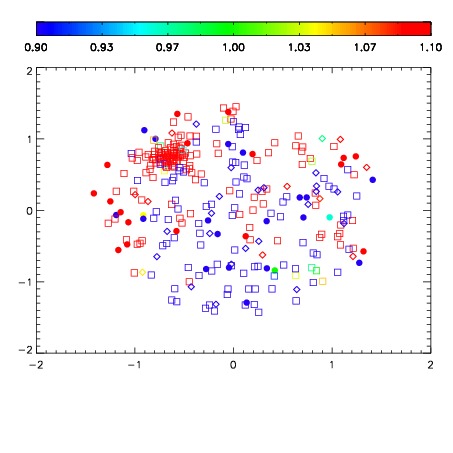
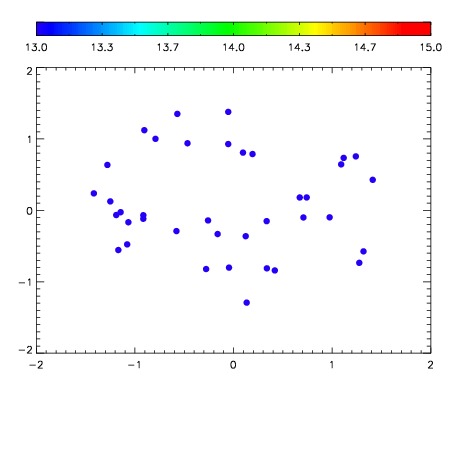

| Frame | Nreads | Zeropoints | Mag plots | Spatial mag deviation | Spatial sky 16325A emission deviations (filled: sky, open: star) | Spatial sky continuum emission | Spatial sky telluric CO2 absorption deviations (filled: H < 10) | |||||||||||||||||||||||
| 0 | 0 |
|
|
|
|
|
|
| IPAIR | NAME | SHIFT | NEWSHIFT | S/N | NAME | SHIFT | NEWSHIFT | S/N |
| 0 | 03760090 | 0.512823 | 0.00000 | 169.093 | 03760091 | 0.000929558 | 0.511893 | 174.930 |
| 1 | 03760094 | 0.511335 | 0.00148797 | 201.965 | 03760095 | 0.00246705 | 0.510356 | 210.381 |
| 2 | 03760093 | 0.510619 | 0.00220400 | 190.715 | 03760092 | 0.00166784 | 0.511155 | 191.904 |
| 3 | 03760089 | 0.512539 | 0.000283957 | 166.381 | 03760088 | 0.00000 | 0.512823 | 132.027 |