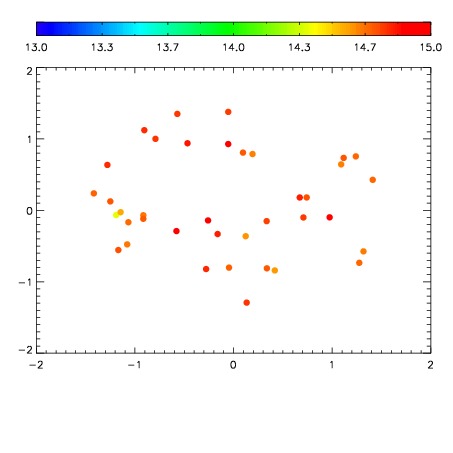
| Frame | Nreads | Zeropoints | Mag plots
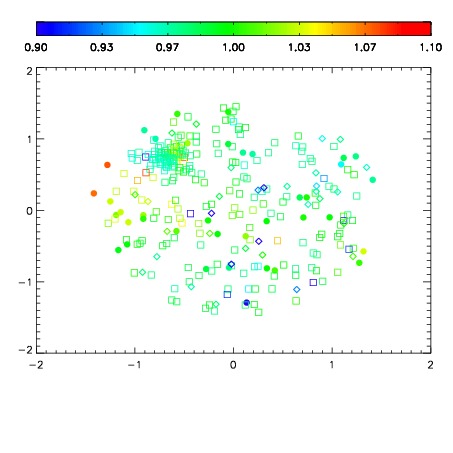
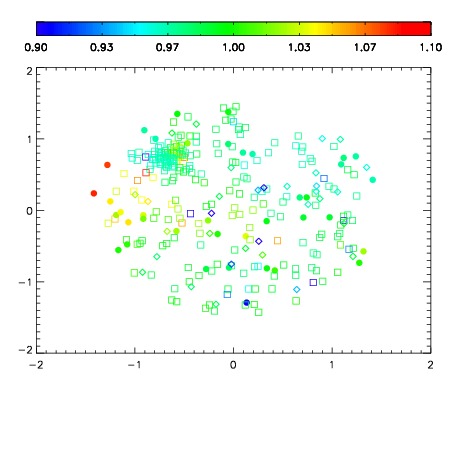
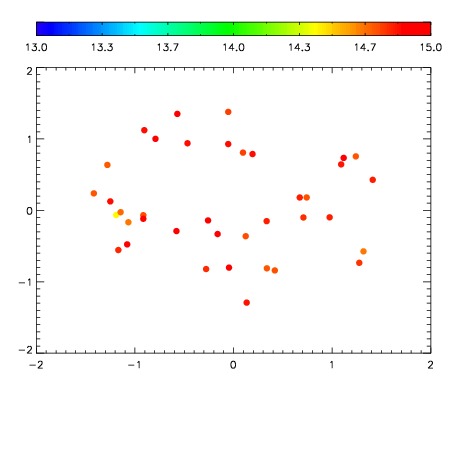
| Spatial mag deviation
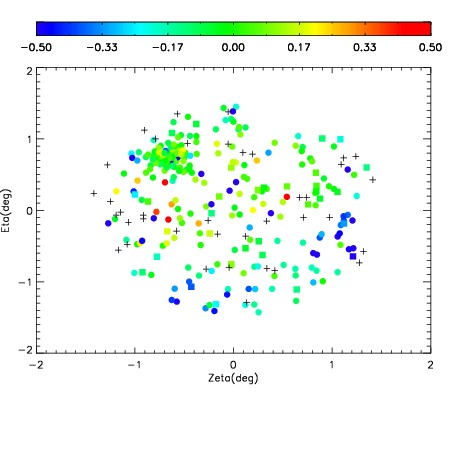
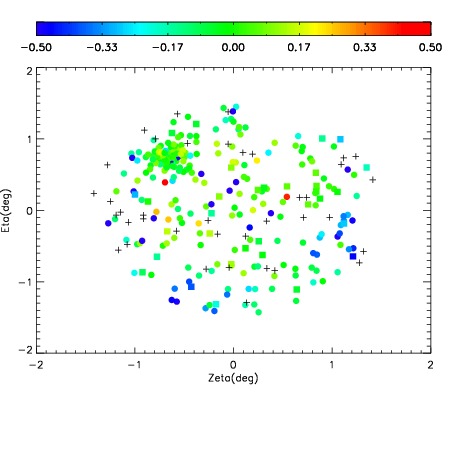
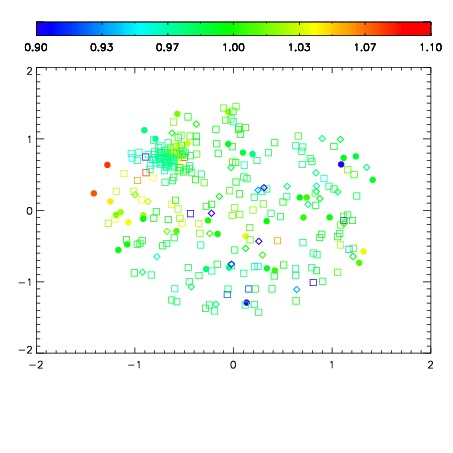
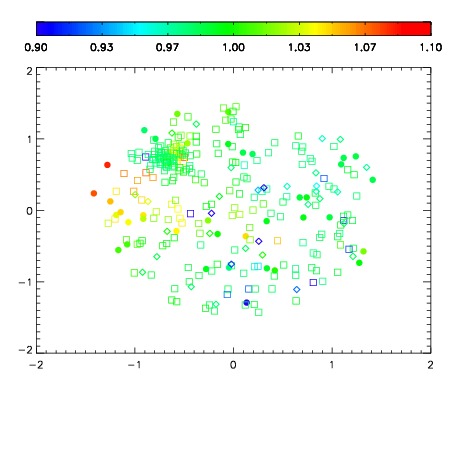
| Spatial sky 16325A emission deviations (filled: sky, open: star)
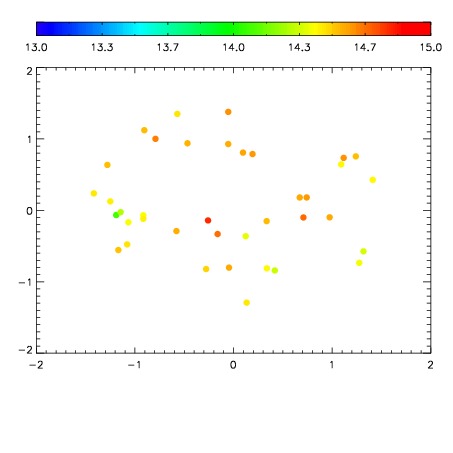
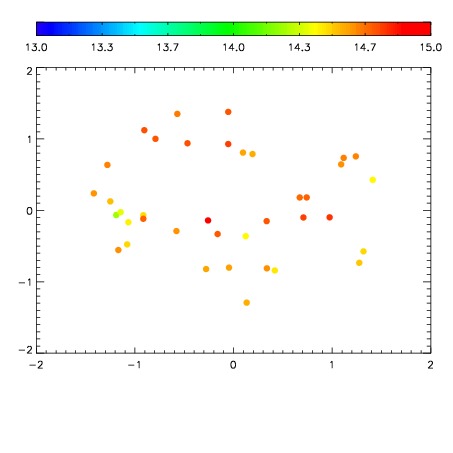
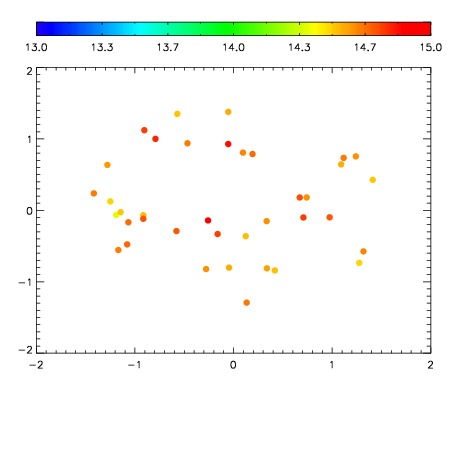
| Spatial sky continuum emission
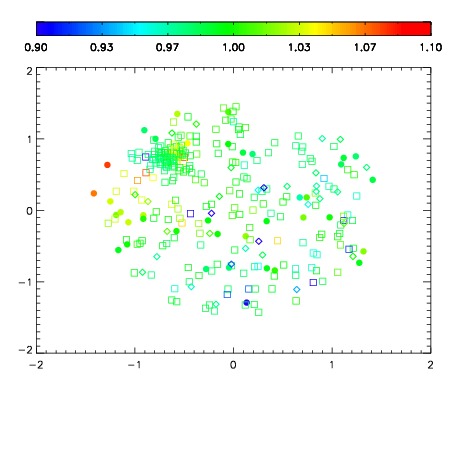
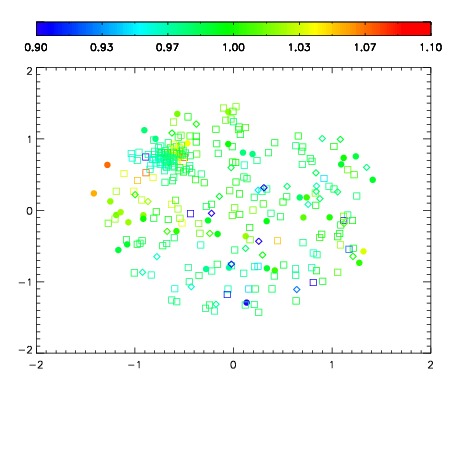
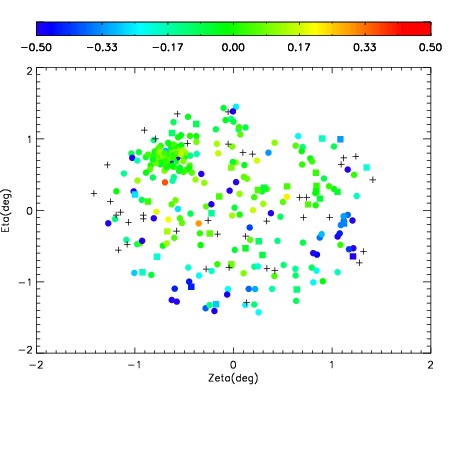
| Spatial sky telluric CO2 absorption deviations (filled: H < 10)
|
| 3770058
| 47
| | Red | Green | Blue
| | z | | 18.77
| | znorm | | 14.59
| | sky | 15.2 | 14.4 | 14.3
| | S/N | 9.7 | 16.6 | 19.5
| | S/N(c) | 8.3 | 15.6 | 18.4
| | SN(E/C) 0.46
|
| 
| 
| 
| 
| 
|
| 3770059
| 47
| | Red | Green | Blue
| | z | | 18.80
| | znorm | | 14.62
| | sky | 15.0 | 14.5 | 14.7
| | S/N | 10.3 | 17.6 | 18.7
| | S/N(c) | 9.0 | 16.6 | 17.6
| | SN(E/C) 0.41
|
| 
| 
| 
| 
| 
|
| 3770060
| 47
| | Red | Green | Blue
| | z | | 18.92
| | znorm | | 14.74
| | sky | 15.1 | 14.6 | 14.7
| | S/N | 11.0 | 18.9 | 19.7
| | S/N(c) | 9.6 | 17.7 | 18.6
| | SN(E/C) 0.44
|
| 
| 
| 
| 
| 
|
| 3770061
| 47
| | Red | Green | Blue
| | z | | 18.84
| | znorm | | 14.66
| | sky | 15.2 | 14.8 | 14.9
| | S/N | 10.4 | 17.7 | 18.3
| | S/N(c) | 8.8 | 16.4 | 17.1
| | SN(E/C) 0.43
|
| 
| 
| 
| 
| 
|
| 3770062
| 47
| | Red | Green | Blue
| | z | | 18.82
| | znorm | | 14.64
| | sky | 15.0 | 14.7 | 14.7
| | S/N | 10.2 | 17.7 | 18.1
| | S/N(c) | 8.8 | 16.5 | 17.1
| | SN(E/C) 0.42
|
| 
| 
| 
| 
| 
|
| 3770063
| 47
| | Red | Green | Blue
| | z | | 18.84
| | znorm | | 14.65
| | sky | 14.9 | 14.6 | 14.8
| | S/N | 10.4 | 18.0 | 18.7
| | S/N(c) | 9.0 | 16.7 | 17.5
| | SN(E/C) 0.43
|
| 
| 
| 
| 
| 
|
| 3770064
| 47
| | Red | Green | Blue
| | z | | 18.77
| | znorm | | 14.59
| | sky | 15.1 | 14.7 | 14.8
| | S/N | 9.7 | 16.9 | 17.8
| | S/N(c) | 8.3 | 15.7 | 16.6
| | SN(E/C) 0.40
|
| 
| 
| 
| 
| 
|
| 3770065
| 47
| | Red | Green | Blue
| | z | | 18.90
| | znorm | | 14.72
| | sky | 15.2 | 14.8 | 14.7
| | S/N | 10.6 | 18.2 | 18.7
| | S/N(c) | 9.1 | 16.8 | 17.8
| | SN(E/C) 0.43
|
| 
| 
| 
| 
| 
|