| Red | Green | Blue | |
| z | 17.64 | ||
| znorm | Inf | ||
| sky | -Inf | -Inf | -Inf |
| S/N | 17.8 | 33.1 | 34.5 |
| S/N(c) | 0.0 | 0.0 | 0.0 |
| SN(E/C) |

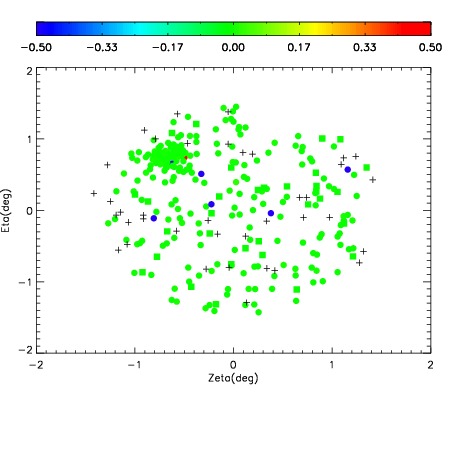
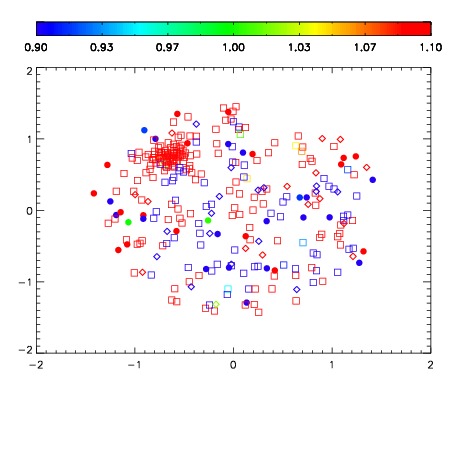
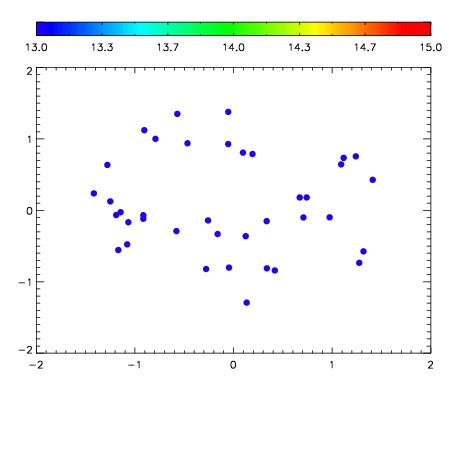

| Frame | Nreads | Zeropoints | Mag plots | Spatial mag deviation | Spatial sky 16325A emission deviations (filled: sky, open: star) | Spatial sky continuum emission | Spatial sky telluric CO2 absorption deviations (filled: H < 10) | |||||||||||||||||||||||
| 0 | 0 |
|
|
|
|
|
|
| IPAIR | NAME | SHIFT | NEWSHIFT | S/N | NAME | SHIFT | NEWSHIFT | S/N |
| 0 | 03770064 | 0.510693 | 0.00000 | 190.457 | 03770058 | 0.00000 | 0.510693 | 191.798 |
| 1 | 03770060 | 0.507435 | 0.00325799 | 204.009 | 03770065 | 0.00632628 | 0.504367 | 201.878 |
| 2 | 03770063 | 0.509471 | 0.00122201 | 195.930 | 03770061 | 0.00256082 | 0.508132 | 194.573 |
| 3 | 03770059 | 0.507432 | 0.00326103 | 193.440 | 03770062 | 0.00363754 | 0.507055 | 193.887 |