| Frame | Nreads | Zeropoints | Mag plots
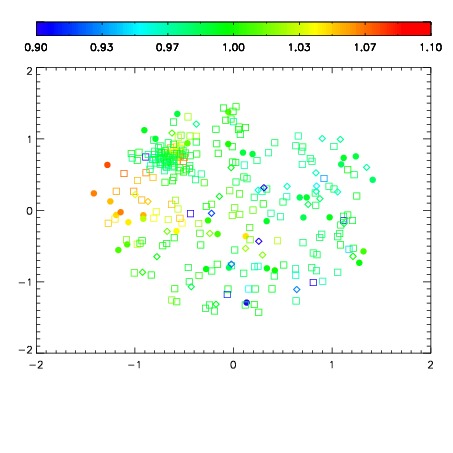
| Spatial mag deviation
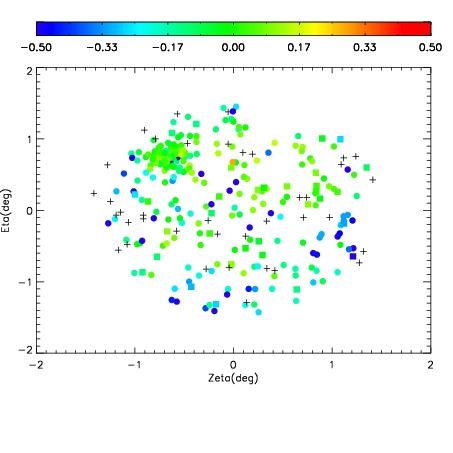
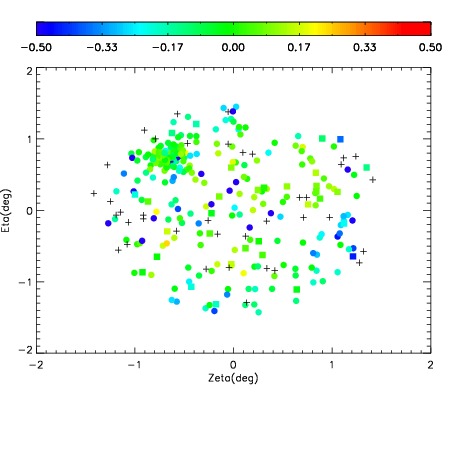
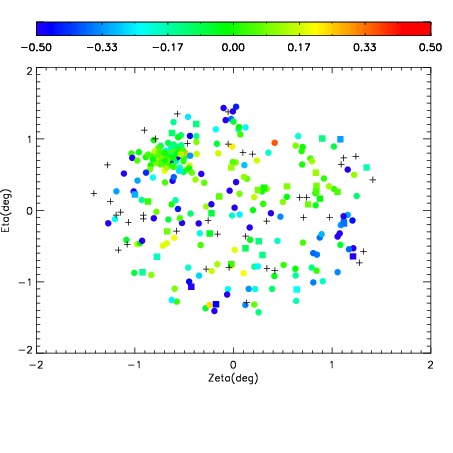
| Spatial sky 16325A emission deviations (filled: sky, open: star)
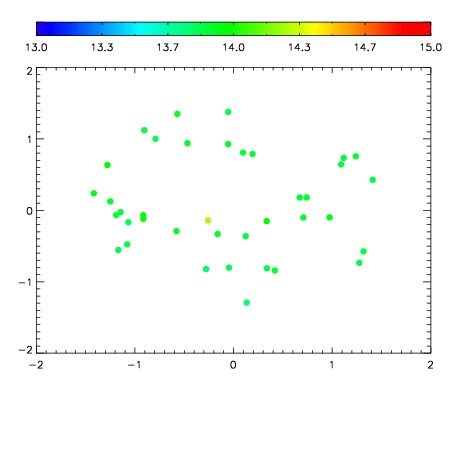
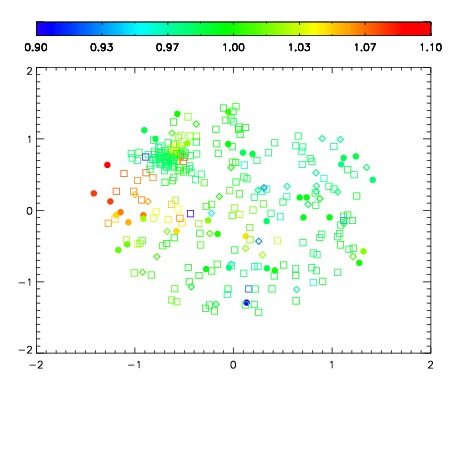
| Spatial sky continuum emission
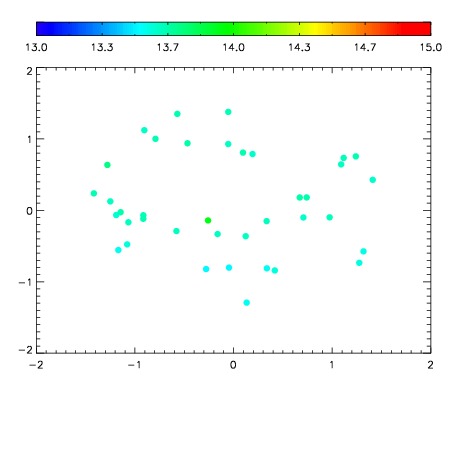
| Spatial sky telluric CO2 absorption deviations (filled: H < 10)
|
| 3790029
| 47
| | Red | Green | Blue
| | z | | 18.98
| | znorm | | 14.80
| | sky | 14.6 | 14.6 | 14.2
| | S/N | 11.4 | 19.1 | 18.6
| | S/N(c) | 10.1 | 17.8 | 17.9
| | SN(E/C) 0.43
|
| 
| 
| 
| 
| 
|
| 3790030
| 47
| | Red | Green | Blue
| | z | | 18.52
| | znorm | | 14.34
| | sky | 14.1 | 14.1 | 14.1
| | S/N | 8.0 | 14.2 | 14.3
| | S/N(c) | 7.0 | 13.2 | 13.7
| | SN(E/C) 0.53
|
| 
| 
| 
| 
| 
|
| 3790031
| 47
| | Red | Green | Blue
| | z | | 18.05
| | znorm | | 13.87
| | sky | 14.0 | 13.9 | 13.8
| | S/N | 5.8 | 10.4 | 11.0
| | S/N(c) | 5.0 | 9.6 | 10.5
| | SN(E/C) 0.60
|
| 
| 
| 
| 
| 
|
| 3790032
| 47
| | Red | Green | Blue
| | z | | 17.49
| | znorm | | 13.31
| | sky | 13.8 | 13.6 | 13.5
| | S/N | 3.4 | 6.5 | 6.4
| | S/N(c) | 2.9 | 5.8 | 6.2
| | SN(E/C) 0.72
|
| 
| 
| 
| 
| 
|