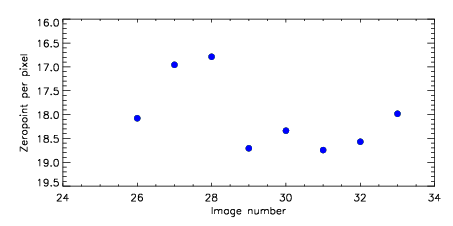
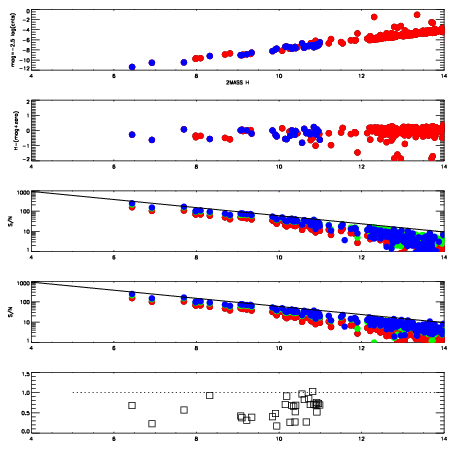
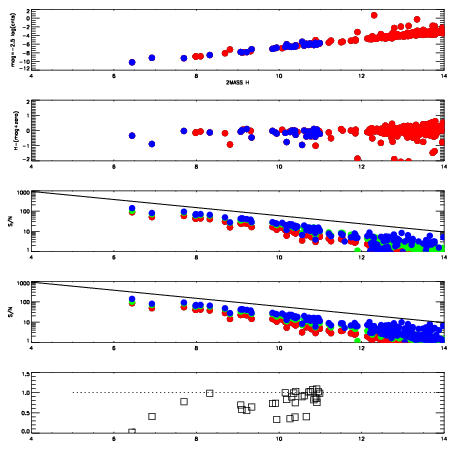
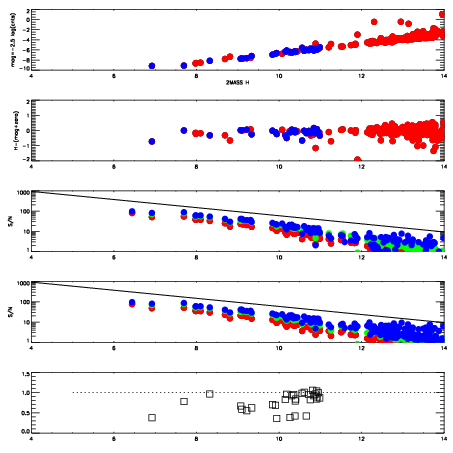
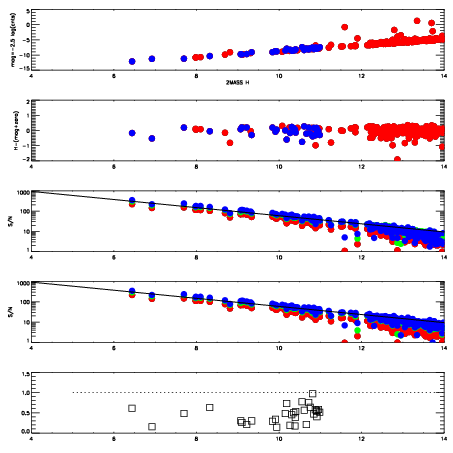
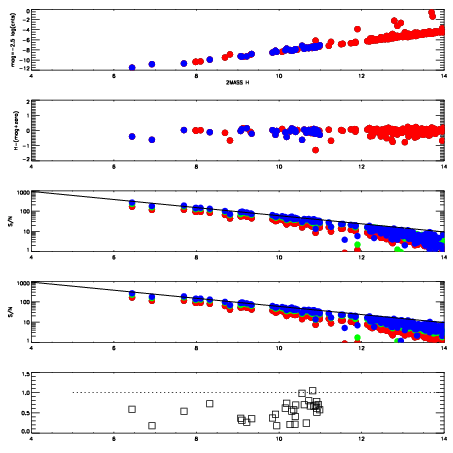
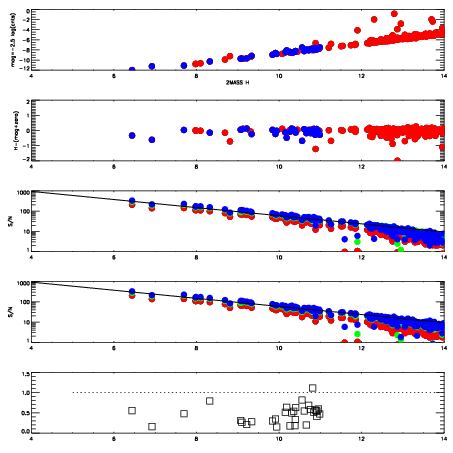
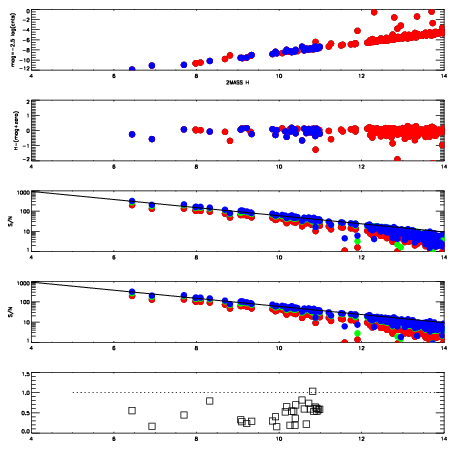
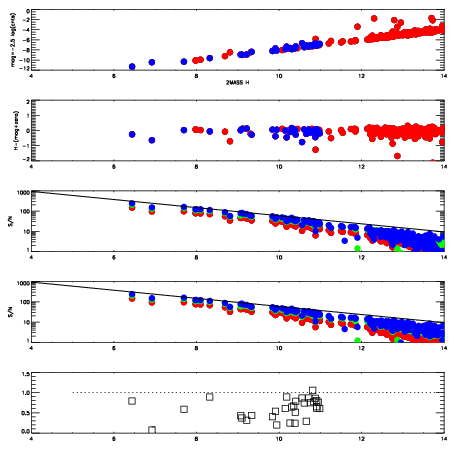
| Frame | Nreads | Zeropoints | Mag plots
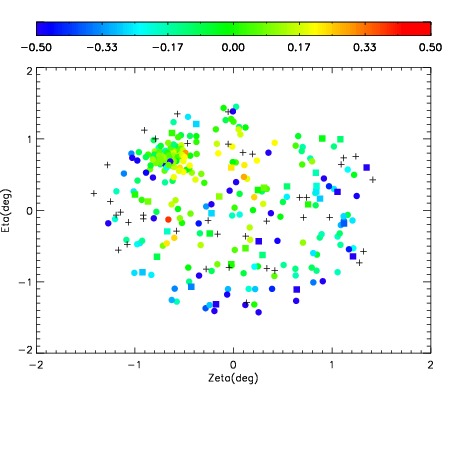
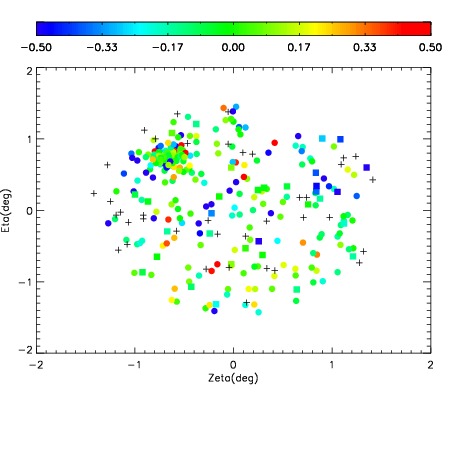
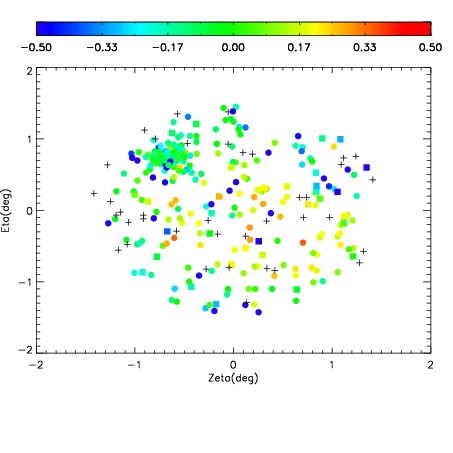
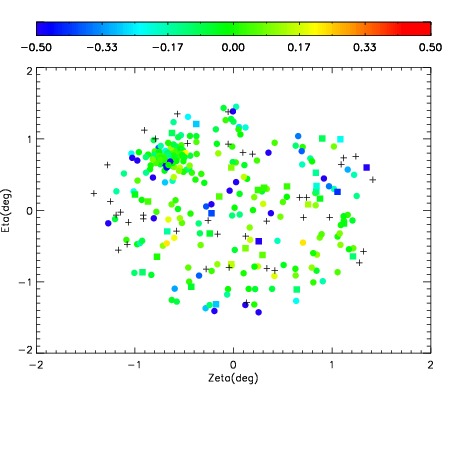
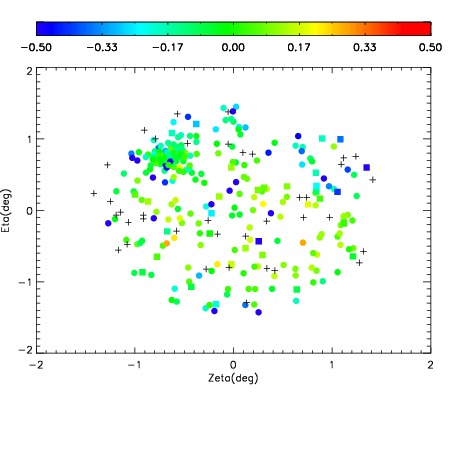
| Spatial mag deviation
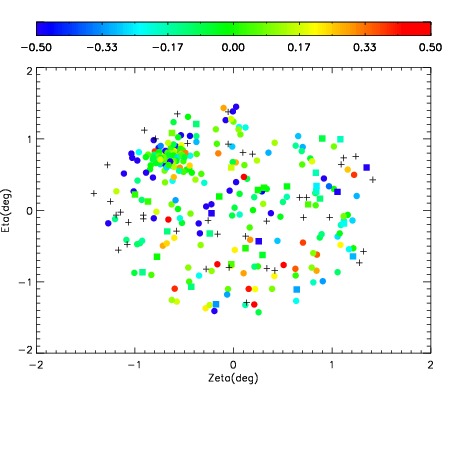
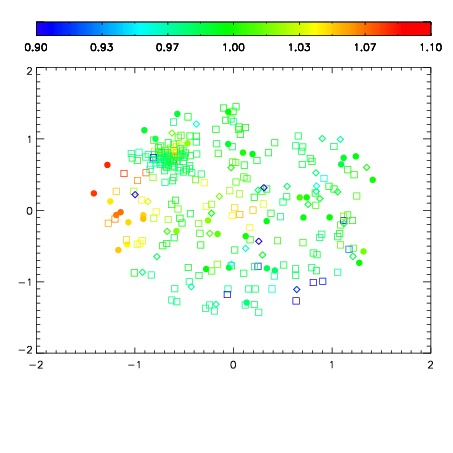
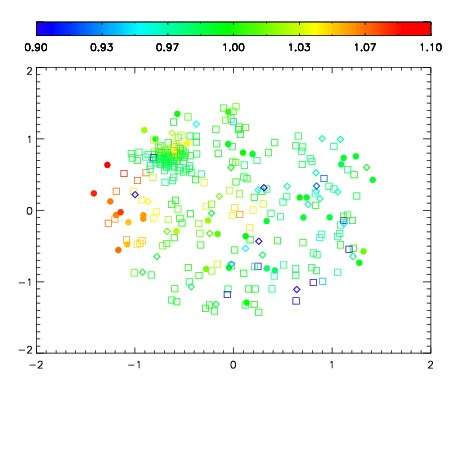
| Spatial sky 16325A emission deviations (filled: sky, open: star)
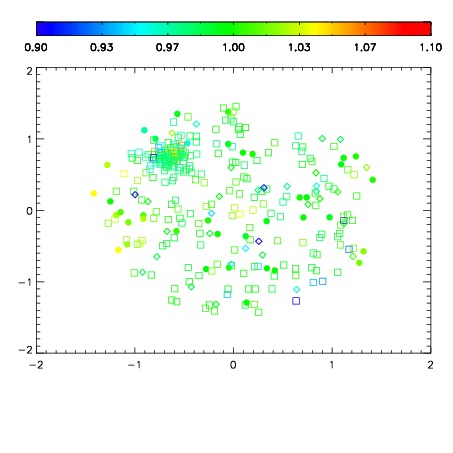
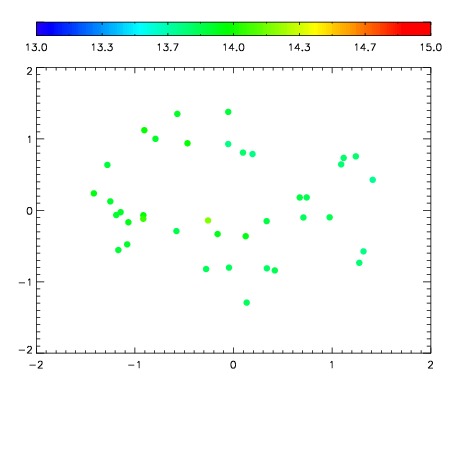
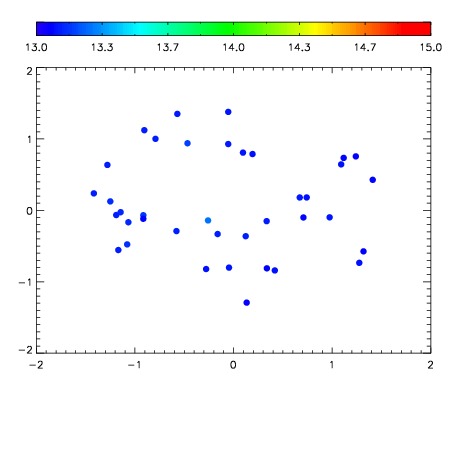
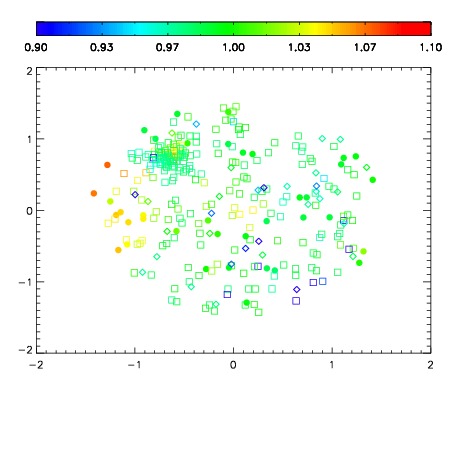
| Spatial sky continuum emission
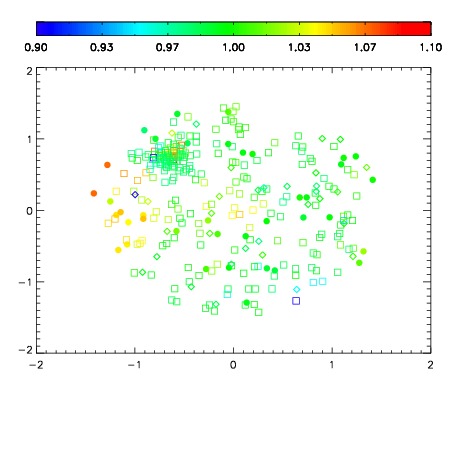
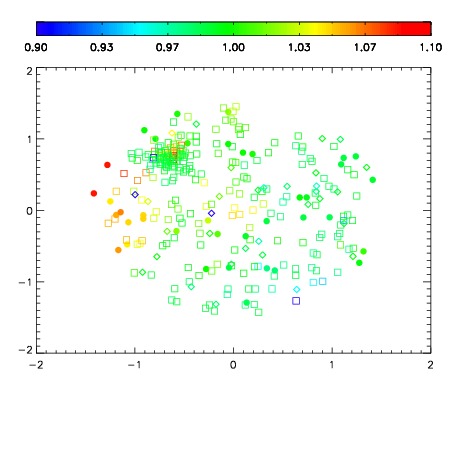
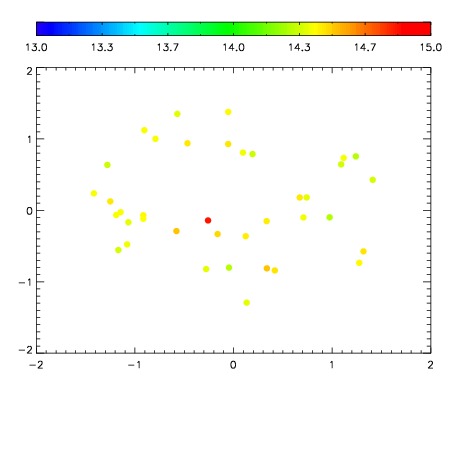
| Spatial sky telluric CO2 absorption deviations (filled: H < 10)
|
| 4880026
| 47
| | Red | Green | Blue
| | z | | 18.08
| | znorm | | 13.90
| | sky | 14.0 | 13.8 | 13.5
| | S/N | 6.8 | 12.7 | 11.4
| | S/N(c) | 5.8 | 11.3 | 12.6
| | SN(E/C) 0.68
|
| 
| 
| 
| 
| 
|
| 4880027
| 47
| | Red | Green | Blue
| | z | | 16.96
| | znorm | | 12.78
| | sky | 13.1 | 13.1 | 13.1
| | S/N | 2.5 | 5.0 | 4.5
| | S/N(c) | 2.3 | 4.3 | 5.9
| | SN(E/C) 0.83
|
| 
| 
| 
| 
| 
|
| 4880028
| 47
| | Red | Green | Blue
| | z | | 16.79
| | znorm | | 12.61
| | sky | 13.1 | 13.2 | 13.2
| | S/N | 2.3 | 4.4 | 3.9
| | S/N(c) | 2.0 | 3.5 | 5.4
| | SN(E/C) 0.84
|
| 
| 
| 
| 
| 
|
| 4880029
| 47
| | Red | Green | Blue
| | z | | 18.71
| | znorm | | 14.53
| | sky | 14.5 | 14.4 | 14.1
| | S/N | 13.5 | 22.3 | 23.1
| | S/N(c) | 12.0 | 21.0 | 23.1
| | SN(E/C) 0.48
|
| 
| 
| 
| 
| 
|
| 4880030
| 47
| | Red | Green | Blue
| | z | | 18.34
| | znorm | | 14.16
| | sky | 13.7 | 13.6 | 13.5
| | S/N | 9.6 | 16.0 | 17.2
| | S/N(c) | 8.4 | 14.9 | 17.4
| | SN(E/C) 0.58
|
| 
| 
| 
| 
| 
|
| 4880031
| 47
| | Red | Green | Blue
| | z | | 18.75
| | znorm | | 14.56
| | sky | 14.1 | 14.1 | 13.9
| | S/N | 12.6 | 21.2 | 22.5
| | S/N(c) | 11.3 | 19.9 | 22.4
| | SN(E/C) 0.51
|
| 
| 
| 
| 
| 
|
| 4880032
| 47
| | Red | Green | Blue
| | z | | 18.57
| | znorm | | 14.39
| | sky | 14.0 | 14.0 | 13.8
| | S/N | 11.5 | 19.4 | 20.5
| | S/N(c) | 10.3 | 18.0 | 20.6
| | SN(E/C) 0.54
|
| 
| 
| 
| 
| 
|
| 4880033
| 47
| | Red | Green | Blue
| | z | | 17.98
| | znorm | | 13.80
| | sky | 13.5 | 13.5 | 13.4
| | S/N | 7.0 | 12.7 | 13.4
| | S/N(c) | 6.0 | 11.5 | 13.4
| | SN(E/C) 0.64
|
| 
| 
| 
| 
| 
|