| Red | Green | Blue | |
| z | 17.64 | ||
| znorm | Inf | ||
| sky | -Inf | -Inf | -Inf |
| S/N | 16.1 | 28.5 | 33.1 |
| S/N(c) | 0.0 | 0.0 | 0.0 |
| SN(E/C) |
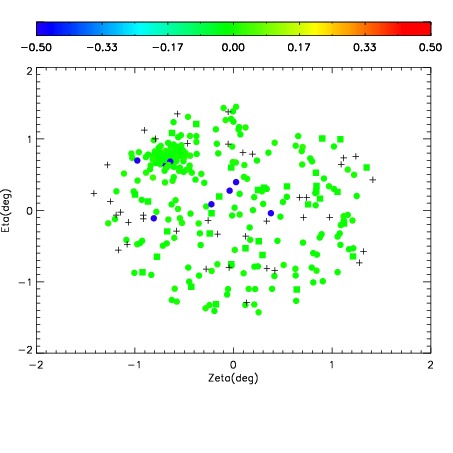
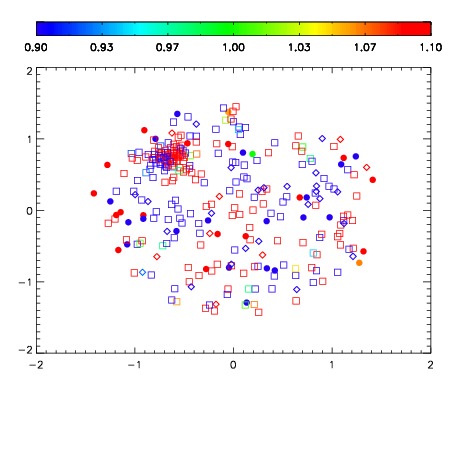
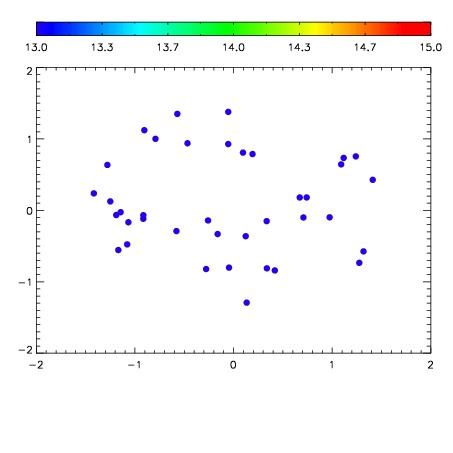

| Frame | Nreads | Zeropoints | Mag plots | Spatial mag deviation | Spatial sky 16325A emission deviations (filled: sky, open: star) | Spatial sky continuum emission | Spatial sky telluric CO2 absorption deviations (filled: H < 10) | |||||||||||||||||||||||
| 0 | 0 |
|
|
|
|
|
|
| IPAIR | NAME | SHIFT | NEWSHIFT | S/N | NAME | SHIFT | NEWSHIFT | S/N |
| 0 | 04880028 | 0.498278 | 0.00000 | 76.7820 | 04880033 | 0.00254369 | 0.495734 | 139.622 |
| 1 | 04880031 | 0.496328 | 0.00195000 | 200.810 | 04880029 | 0.000355297 | 0.497923 | 212.794 |
| 2 | 04880032 | 0.497388 | 0.000889987 | 188.458 | 04880030 | 0.000495823 | 0.497782 | 165.248 |
| 3 | 04880027 | 0.497376 | 0.000901997 | 82.1878 | 04880026 | 0.00000 | 0.498278 | 149.966 |