| Red | Green | Blue | |
| z | 17.64 | ||
| znorm | Inf | ||
| sky | -Inf | -Inf | -Inf |
| S/N | 25.5 | 43.6 | 50.7 |
| S/N(c) | 0.0 | 0.0 | 0.0 |
| SN(E/C) |
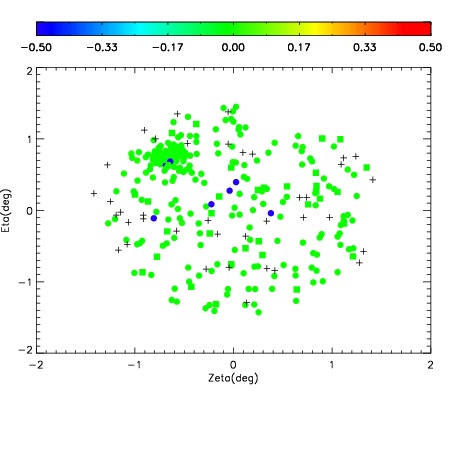
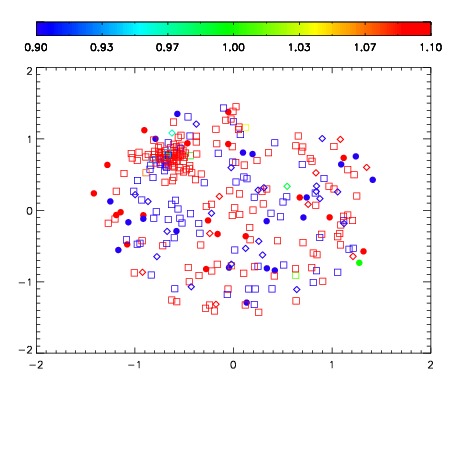
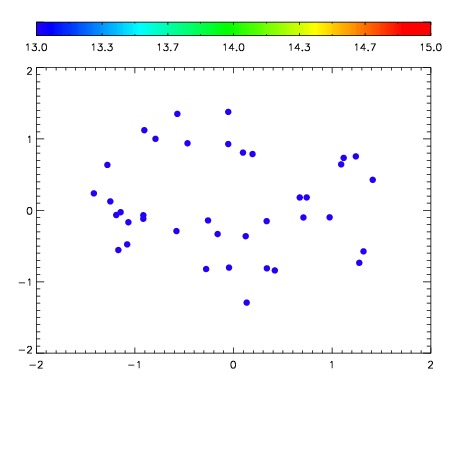

| Frame | Nreads | Zeropoints | Mag plots | Spatial mag deviation | Spatial sky 16325A emission deviations (filled: sky, open: star) | Spatial sky continuum emission | Spatial sky telluric CO2 absorption deviations (filled: H < 10) | |||||||||||||||||||||||
| 0 | 0 |
|
|
|
|
|
|
| IPAIR | NAME | SHIFT | NEWSHIFT | S/N | NAME | SHIFT | NEWSHIFT | S/N |
| 0 | 04890027 | 0.492385 | 0.00000 | 221.962 | 04890028 | 0.00267528 | 0.489710 | 221.658 |
| 1 | 04890030 | 0.490104 | 0.00228101 | 225.792 | 04890032 | 0.00268542 | 0.489700 | 224.790 |
| 2 | 04890031 | 0.492164 | 0.000221014 | 224.899 | 04890029 | 0.000494883 | 0.491890 | 222.924 |
| 3 | 04890026 | 0.491365 | 0.00102001 | 219.683 | 04890025 | 0.00000 | 0.492385 | 208.968 |