| Red | Green | Blue | |
| z | 17.64 | ||
| znorm | Inf | ||
| sky | -Inf | -Inf | -Inf |
| S/N | 24.0 | 41.1 | 48.6 |
| S/N(c) | 0.0 | 0.0 | 0.0 |
| SN(E/C) |
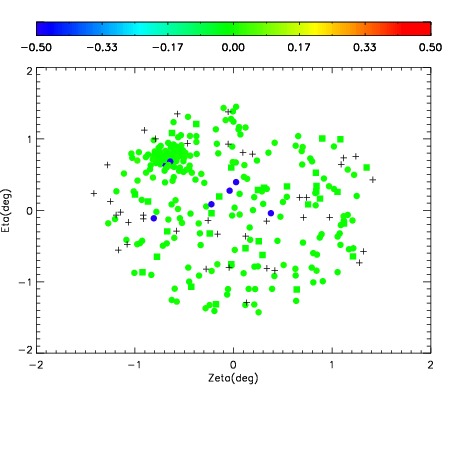
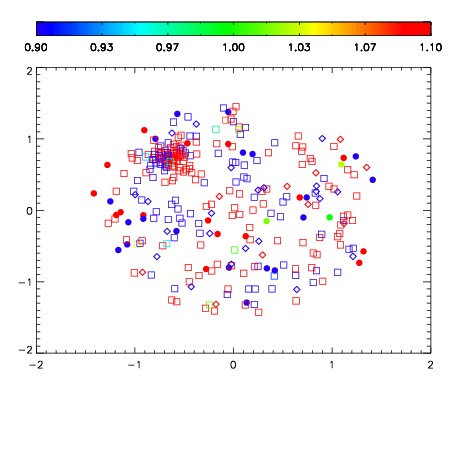
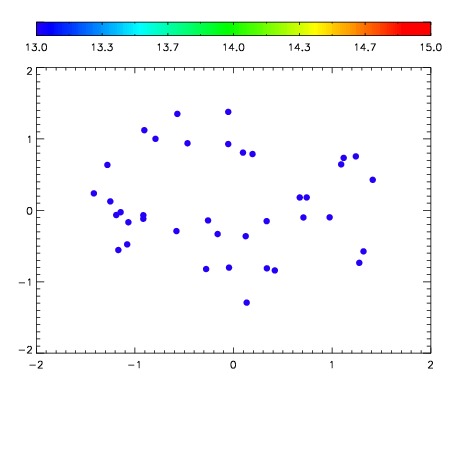

| Frame | Nreads | Zeropoints | Mag plots | Spatial mag deviation | Spatial sky 16325A emission deviations (filled: sky, open: star) | Spatial sky continuum emission | Spatial sky telluric CO2 absorption deviations (filled: H < 10) | |||||||||||||||||||||||
| 0 | 0 |
|
|
|
|
|
|
| IPAIR | NAME | SHIFT | NEWSHIFT | S/N | NAME | SHIFT | NEWSHIFT | S/N |
| 0 | 04900031 | 0.487830 | 0.00000 | 220.937 | 04900029 | 0.00143496 | 0.486395 | 221.893 |
| 1 | 04900030 | 0.486806 | 0.00102401 | 211.959 | 04900032 | 0.00270011 | 0.485130 | 220.422 |
| 2 | 04900027 | 0.486364 | 0.00146601 | 209.100 | 04900028 | 0.00140593 | 0.486424 | 218.708 |
| 3 | 04900026 | 0.486027 | 0.00180301 | 178.036 | 04900025 | 0.00000 | 0.487830 | 188.747 |