| Red | Green | Blue | |
| z | 17.64 | ||
| znorm | Inf | ||
| sky | -Inf | -Inf | -Inf |
| S/N | 25.7 | 44.5 | 51.6 |
| S/N(c) | 0.0 | 0.0 | 0.0 |
| SN(E/C) |
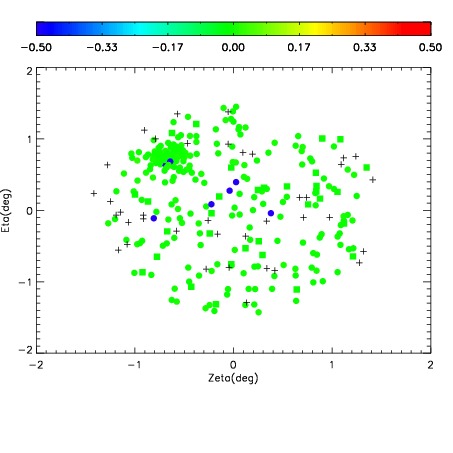
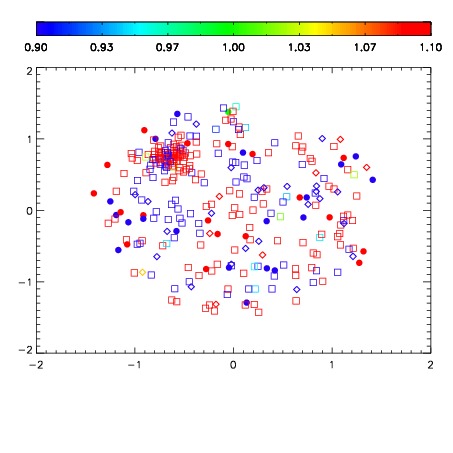
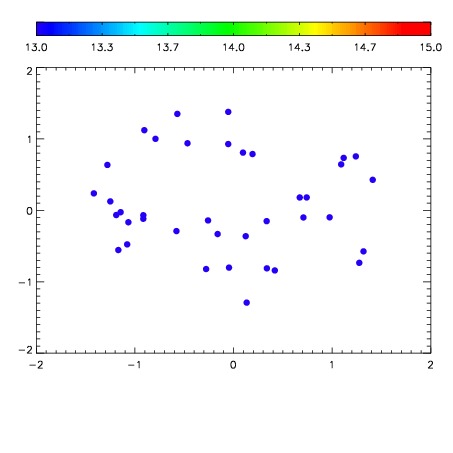

| Frame | Nreads | Zeropoints | Mag plots | Spatial mag deviation | Spatial sky 16325A emission deviations (filled: sky, open: star) | Spatial sky continuum emission | Spatial sky telluric CO2 absorption deviations (filled: H < 10) | |||||||||||||||||||||||
| 0 | 0 |
|
|
|
|
|
|
| IPAIR | NAME | SHIFT | NEWSHIFT | S/N | NAME | SHIFT | NEWSHIFT | S/N |
| 0 | 04910031 | 0.489946 | 0.00000 | 228.842 | 04910032 | 0.00293199 | 0.487014 | 225.509 |
| 1 | 04910030 | 0.488727 | 0.00121900 | 222.626 | 04910029 | 0.00147678 | 0.488469 | 224.671 |
| 2 | 04910027 | 0.488865 | 0.00108102 | 221.651 | 04910028 | 0.00170961 | 0.488236 | 220.665 |
| 3 | 04910026 | 0.487927 | 0.00201902 | 208.942 | 04910025 | 0.00000 | 0.489946 | 208.678 |