| Red | Green | Blue | |
| z | 17.64 | ||
| znorm | Inf | ||
| sky | -Inf | -Inf | -Inf |
| S/N | 28.7 | 48.4 | 59.2 |
| S/N(c) | 0.0 | 0.0 | 0.0 |
| SN(E/C) |

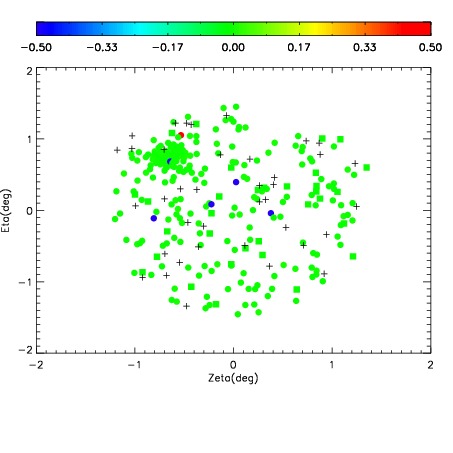

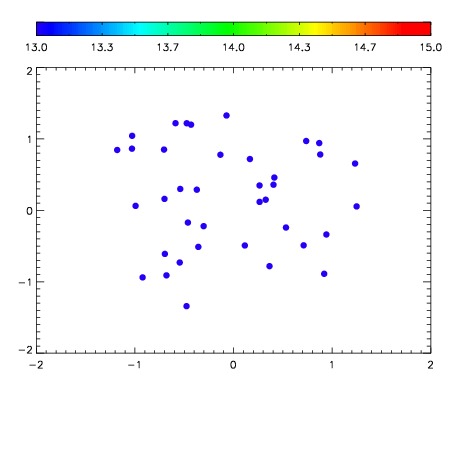

| Frame | Nreads | Zeropoints | Mag plots | Spatial mag deviation | Spatial sky 16325A emission deviations (filled: sky, open: star) | Spatial sky continuum emission | Spatial sky telluric CO2 absorption deviations (filled: H < 10) | |||||||||||||||||||||||
| 0 | 0 |
|
|
|
|
|
|
| IPAIR | NAME | SHIFT | NEWSHIFT | S/N | NAME | SHIFT | NEWSHIFT | S/N |
| 0 | 05150034 | 0.499716 | 0.00000 | 212.160 | 05150035 | 0.00414595 | 0.495570 | 211.867 |
| 1 | 05150030 | 0.498336 | 0.00138003 | 218.344 | 05150028 | 0.00000 | 0.499716 | 214.510 |
| 2 | 05150029 | 0.497388 | 0.00232801 | 217.883 | 05150031 | 0.00124806 | 0.498468 | 212.193 |
| 3 | 05150033 | 0.499295 | 0.000421017 | 210.436 | 05150032 | 0.00187545 | 0.497841 | 209.756 |